Fig. 11
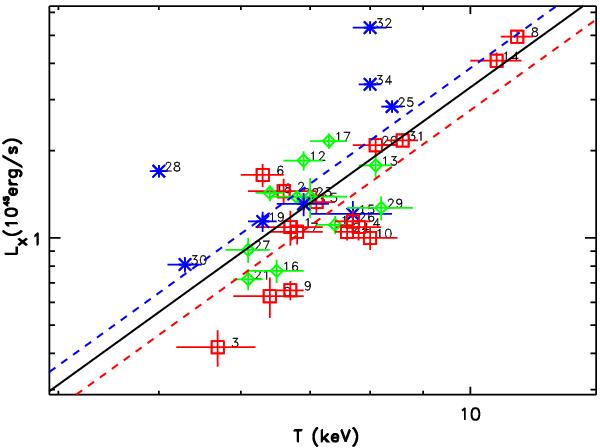
LX − T relation with the fitted results from the BCES(Y|X) method. The black solid line is the best fit for all 35 clusters, the blue dashed line is that for the regular and the intermediate clusters, and the red dashed line for the disturbed clusters. The fitted normalisations for the two sub-groups in blue and red move to the opposite directions from the best fit found for all clusters. The numbering of the clusters follows that of Fig. 1.
Current usage metrics show cumulative count of Article Views (full-text article views including HTML views, PDF and ePub downloads, according to the available data) and Abstracts Views on Vision4Press platform.
Data correspond to usage on the plateform after 2015. The current usage metrics is available 48-96 hours after online publication and is updated daily on week days.
Initial download of the metrics may take a while.