Fig. 1
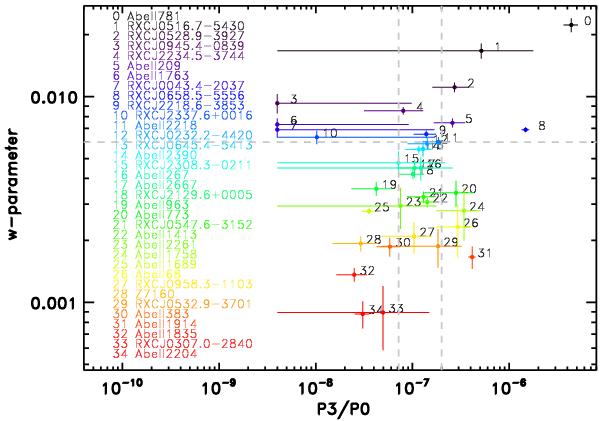
Centre shift and averaged P3 parameters. Clearly seen are the five most disturbed clusters in the upper right corner with the largest w and P3 values. The intermediate cases are bounded by the two vertical dashed lines below the horizontal line, and the regular clusters are located in the left lower corner. Clusters 3, 6, 7, and 10 have very low P3 values, however, they are classified as disturbed given the large centre shifts. In the same way 20, 24, 26, and 31 are disturbed due to their large P3 values. Clusters are numerically labelled by their w values in descending order.
Current usage metrics show cumulative count of Article Views (full-text article views including HTML views, PDF and ePub downloads, according to the available data) and Abstracts Views on Vision4Press platform.
Data correspond to usage on the plateform after 2015. The current usage metrics is available 48-96 hours after online publication and is updated daily on week days.
Initial download of the metrics may take a while.