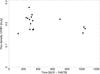
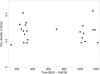
Fig. A.1
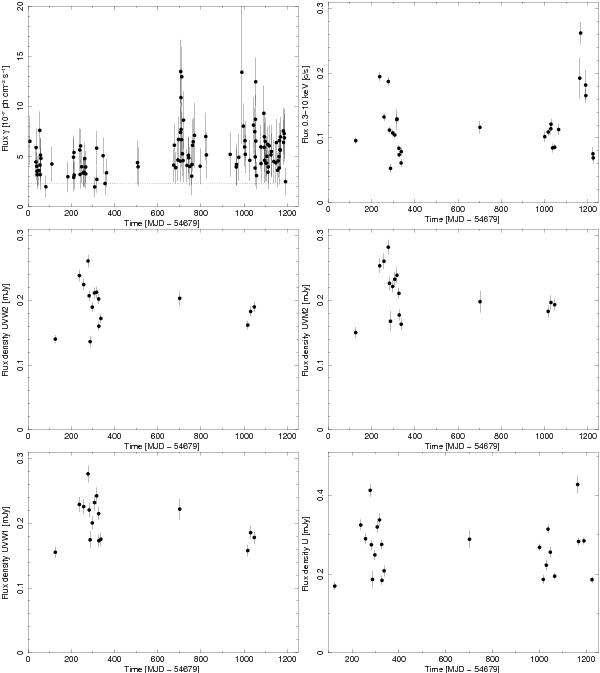
Light curves at various frequencies. From top left to bottom right panel: γ-ray 0.1–300 GeV from Fermi/LAT, with 1 day time bin [10-7 ph cm-2 s-1] (the horizontal dotted line correspond to a TS = 4 average upper limit of 2.3 × 10⁻⁷ ph cm-2 s-1 for a one-day exposure); X-ray 0.3–10 keV from Swift/XRT [c s-1]; UVW2 from Swift/UVOT [mJy]; UVM2 from Swift/UVOT [mJy]; UVW1 from Swift/UVOT [mJy]; U from Swift/UVOT [mJy]. Time starts on 2008 August 1 00:00 UTC (MJD 54 679).

Current usage metrics show cumulative count of Article Views (full-text article views including HTML views, PDF and ePub downloads, according to the available data) and Abstracts Views on Vision4Press platform.
Data correspond to usage on the plateform after 2015. The current usage metrics is available 48-96 hours after online publication and is updated daily on week days.
Initial download of the metrics may take a while.