Fig. 6c
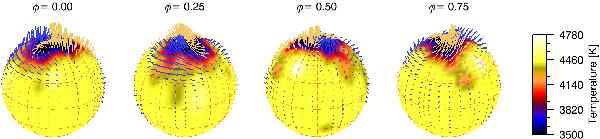
Orthographic maps of the temperature overplotted by the magnetic field lines at four different rotational phases φ. For a better visibility the positive fields are color coded in yellow while the negative fields are again in blue. As above the field lines are proportional to the strength of the field.
Current usage metrics show cumulative count of Article Views (full-text article views including HTML views, PDF and ePub downloads, according to the available data) and Abstracts Views on Vision4Press platform.
Data correspond to usage on the plateform after 2015. The current usage metrics is available 48-96 hours after online publication and is updated daily on week days.
Initial download of the metrics may take a while.