Free Access
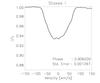
Fig. 4
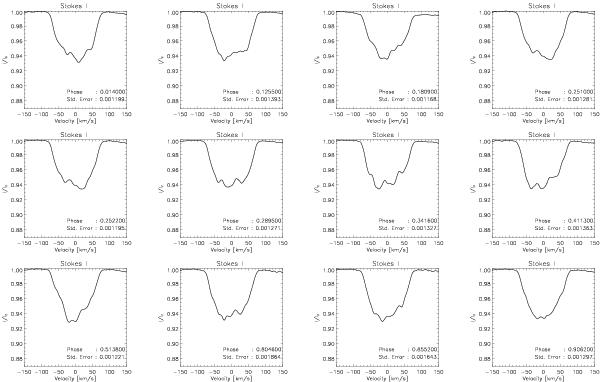
Reconstructed SVD Stokes I profiles for each rotational phase. For all reconstructed profiles an observation matrix with 56 spectral lines is used. The averaged standard error is given together with the corresponding rotational phase.
This figure is made of several images, please see below:


Current usage metrics show cumulative count of Article Views (full-text article views including HTML views, PDF and ePub downloads, according to the available data) and Abstracts Views on Vision4Press platform.
Data correspond to usage on the plateform after 2015. The current usage metrics is available 48-96 hours after online publication and is updated daily on week days.
Initial download of the metrics may take a while.