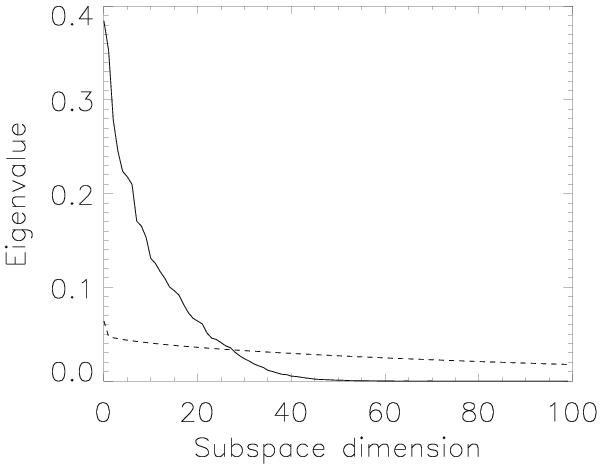
Fig. 1

Stokes V eigenvalue spectrum of a V410-Tau observation (solid line) and the mean eigenvalue spectrum obtained from a bootstrap randomization process (dashed line) for the first 100 dimensions of rotation phase 0.014. The magnitude of the eigenvalues of the corresponding observation covariance matrix and the mean eigenvalues of all randomized matrices are plotted over the corresponding subspace dimension index. The crossing point at dimension 27 marks the dimension from which on the individual eigenprofiles contain no more significant information.
Current usage metrics show cumulative count of Article Views (full-text article views including HTML views, PDF and ePub downloads, according to the available data) and Abstracts Views on Vision4Press platform.
Data correspond to usage on the plateform after 2015. The current usage metrics is available 48-96 hours after online publication and is updated daily on week days.
Initial download of the metrics may take a while.


