Fig. 9
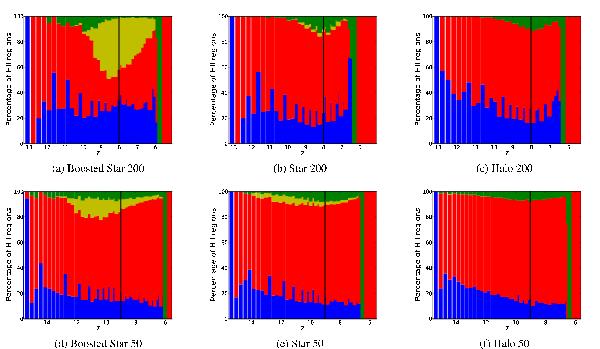
Evolution of the proportion of each kind of HII regions as a function of redshift for the three models of ionizing sources and for both boxes of 200 and 50 Mpc/h. Panels a)–c) respectively represents the distribution for the Boosted Star, the Star, and the Halo model for the 200 Mpc/h box, while the panels d)–f) are for the same models but for the 50 Mpc/h box. The colors stand for the new HII regions (blue), the expanding regions (red), the regions that will recombine (yellow), and the regions resulting from mergers (green). The black vertical line shows the peak of the absolute number of HII regions: zpeak.
Current usage metrics show cumulative count of Article Views (full-text article views including HTML views, PDF and ePub downloads, according to the available data) and Abstracts Views on Vision4Press platform.
Data correspond to usage on the plateform after 2015. The current usage metrics is available 48-96 hours after online publication and is updated daily on week days.
Initial download of the metrics may take a while.