Fig. 14
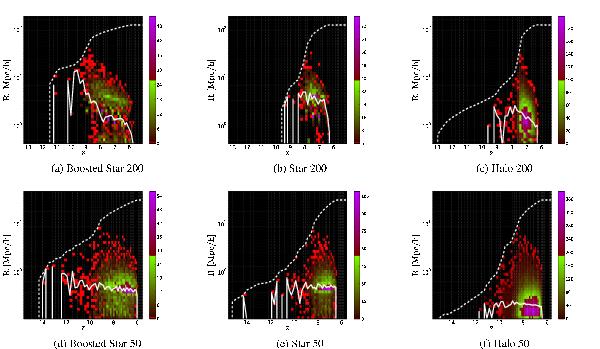
Distribution of the HII regions sizes for the regions that merge with the dominant region as a function of redshift for the three kinds of ionizing sources and for both box sizes of 200 and 50 Mpc/h. Panels a)–c) respectively represent the distribution for the Boosted Star, the Star, and the Halo model for the 200 Mpc/h box, while the panels d)–f) are for the same models but for the 50 Mpc/h box. The brightest red cells represent the location in the distribution populated by a single HII region; other red tones up to the brightest green cells span distribution densities from a couple HII regions up to a value corresponding to half the maximum value of the distribution. The purple tones (from the darkest to the brightest) denote the maximum values. The evolution of the average radius for the regions that merge with the dominant region and the evolution of the radius of the main region are represented with the solid and dashed white lines, respectively.
Current usage metrics show cumulative count of Article Views (full-text article views including HTML views, PDF and ePub downloads, according to the available data) and Abstracts Views on Vision4Press platform.
Data correspond to usage on the plateform after 2015. The current usage metrics is available 48-96 hours after online publication and is updated daily on week days.
Initial download of the metrics may take a while.