Fig. 4
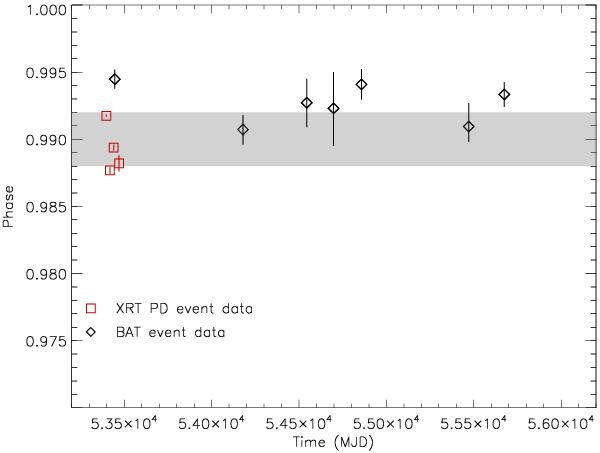
Phase position of the Crab pulsar main peak for XRT-PD (red squares) and BAT (black diamonds) observations. The shaded strip marks the phase range where the main peak is measured by RXTE-PCA. For each instrument, observations with the same radio ephemeris sample interval were folded together and are thus represented by a single point.
Current usage metrics show cumulative count of Article Views (full-text article views including HTML views, PDF and ePub downloads, according to the available data) and Abstracts Views on Vision4Press platform.
Data correspond to usage on the plateform after 2015. The current usage metrics is available 48-96 hours after online publication and is updated daily on week days.
Initial download of the metrics may take a while.