Fig. 3
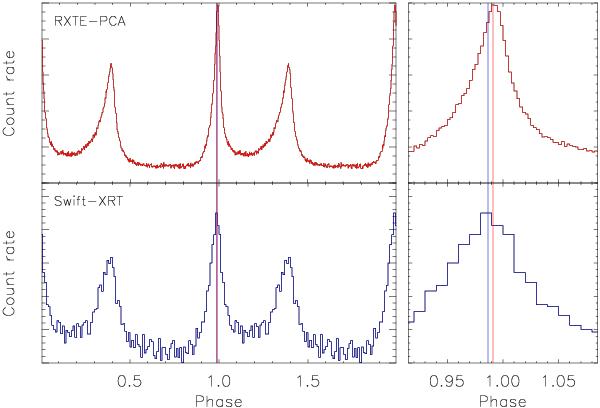
Comparison between the Crab pulse profile obtained with RXTE-PCA (top panels) and that obtained with the Swift-XRT Obs ID 00050100031. The count rates in the Y-axis are in arbitrary units. Vertical lines mark the position of the main peak (red: RXTE-PCA; blue: Swift-XRT). The right panels show a zoom of the main peak interval.
Current usage metrics show cumulative count of Article Views (full-text article views including HTML views, PDF and ePub downloads, according to the available data) and Abstracts Views on Vision4Press platform.
Data correspond to usage on the plateform after 2015. The current usage metrics is available 48-96 hours after online publication and is updated daily on week days.
Initial download of the metrics may take a while.