Fig. 1
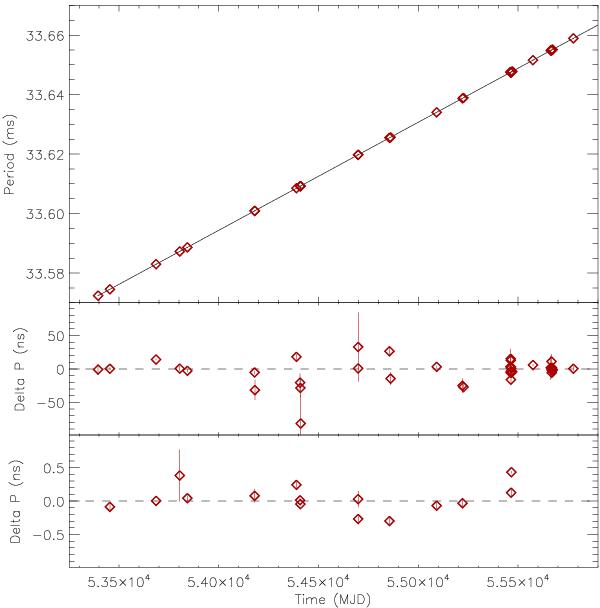
Top panel: best periods obtained for each observation (Col. 6, Table 1) as weighted mean of the folding analysis results performed on single snapshots. The solid line connects the periods extrapolated at the folding epoch times from the radio ephemeris (Col. 8, Table 1). Central panel: residuals between the best periods plotted above and the corresponding periods as extrapolated from the radio ephemeris. Bottom panel: residuals between the periods obtained from the pulse phase analysis (Col. 2, Table 2) and those extrapolated from the radio ephemeris (Col. 8, Table 1). Due to the Y-axis range in the three panels, errors for several points are too small to be visible.
Current usage metrics show cumulative count of Article Views (full-text article views including HTML views, PDF and ePub downloads, according to the available data) and Abstracts Views on Vision4Press platform.
Data correspond to usage on the plateform after 2015. The current usage metrics is available 48-96 hours after online publication and is updated daily on week days.
Initial download of the metrics may take a while.