Fig. 9
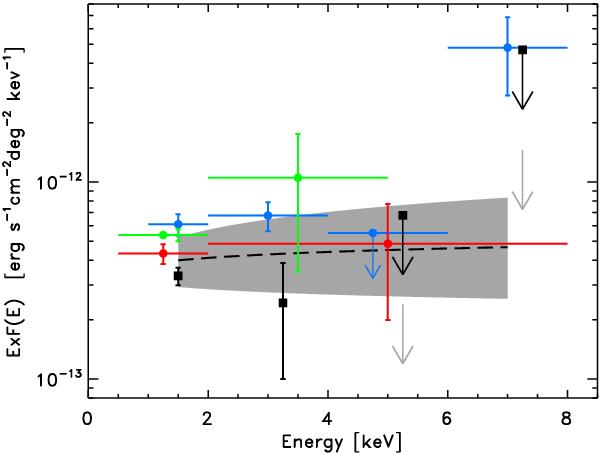
Comparison among different measures of the contribution of optical/IR (X-ray undetected) to the X-ray background. The gray area represents the best fit to our data. Green, blue, and red points represent the photometry of Hickox & Markevitch (2007), Luo et al. (2011), and Cowie et al. (2012). Black squares and arrows represent our photometric values and 2σ upper limits including systematic error of 2% on the background measure. Gray arrows show the upper limits accounting only for statistical errors.
Current usage metrics show cumulative count of Article Views (full-text article views including HTML views, PDF and ePub downloads, according to the available data) and Abstracts Views on Vision4Press platform.
Data correspond to usage on the plateform after 2015. The current usage metrics is available 48-96 hours after online publication and is updated daily on week days.
Initial download of the metrics may take a while.