Fig. 7
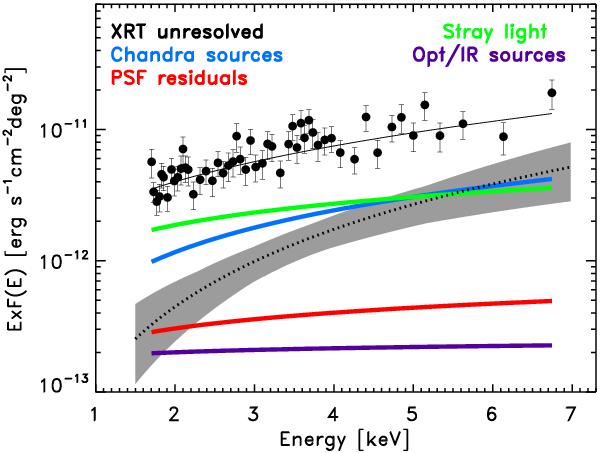
Results of the fit procedure. We modeled the XRT unresolved spectrum as the sum of five components, each fit by a power law. Colors are the same as in the previous figure: (i) Chandra sources not detected by XRT (blue); x (iii) bright sources PSF residuals (red); (iv) stray-light contamination (green); (iv) X-ray emission of optical/IR sources (violet). The fifth component, the truly unresolved emission, which is our aim, is plotted with its uncertainties as the gray area.
Current usage metrics show cumulative count of Article Views (full-text article views including HTML views, PDF and ePub downloads, according to the available data) and Abstracts Views on Vision4Press platform.
Data correspond to usage on the plateform after 2015. The current usage metrics is available 48-96 hours after online publication and is updated daily on week days.
Initial download of the metrics may take a while.