Fig. 5
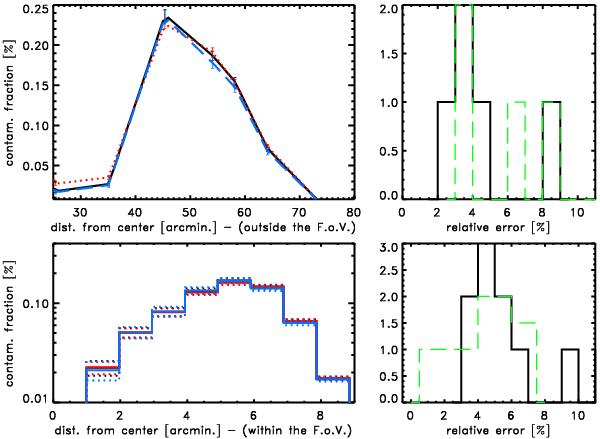
Upper-left panel: fraction of the flux of a source outside of the field of view falling within the annulus between 5 and 6 arcmin. Black, red, and blue points represent the fraction measured in the Crab calibration observations in the total (1.5–7.0), soft (1.0–2.0), and hard bands respectively. Lines are the linear interpolation between the measures. Upper-right panel: black line is the calibration measure error histogram. Green dashed line is the histogram of the relative difference, between soft and hard band. Lower-left panel: the stray-light contamination on the XRT detector from a uniform source in different concentric annuli on the detector, accounting for the CDFS exposure map. Right-lower panel: black line is the error histogram. Green dashed line is again the histogram of the soft/hard relative difference.
Current usage metrics show cumulative count of Article Views (full-text article views including HTML views, PDF and ePub downloads, according to the available data) and Abstracts Views on Vision4Press platform.
Data correspond to usage on the plateform after 2015. The current usage metrics is available 48-96 hours after online publication and is updated daily on week days.
Initial download of the metrics may take a while.