Fig. 4
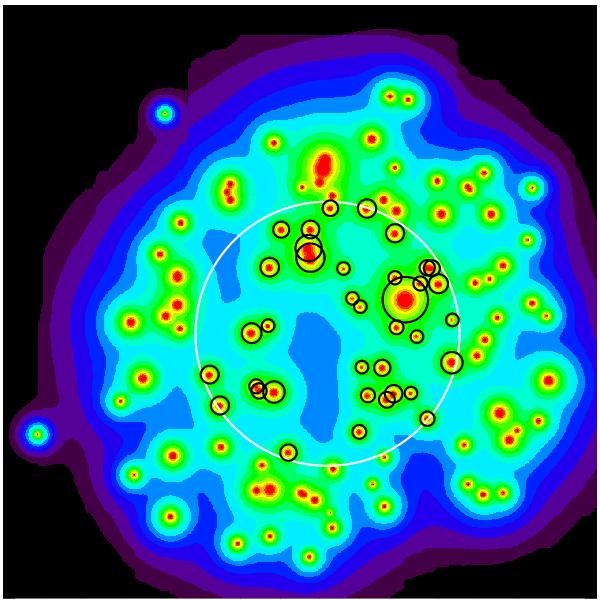
The PSF model of the 109 sources detected in the XRT observation at 2.5 keV energy. The large white circle shows the boundaries of our ROI, while small black circles show regions we excised (rext). The PSF residuals is the small, but not negligible signal outside small circles and within the ROI.
Current usage metrics show cumulative count of Article Views (full-text article views including HTML views, PDF and ePub downloads, according to the available data) and Abstracts Views on Vision4Press platform.
Data correspond to usage on the plateform after 2015. The current usage metrics is available 48-96 hours after online publication and is updated daily on week days.
Initial download of the metrics may take a while.