Press Release
Free Access
Fig. 3
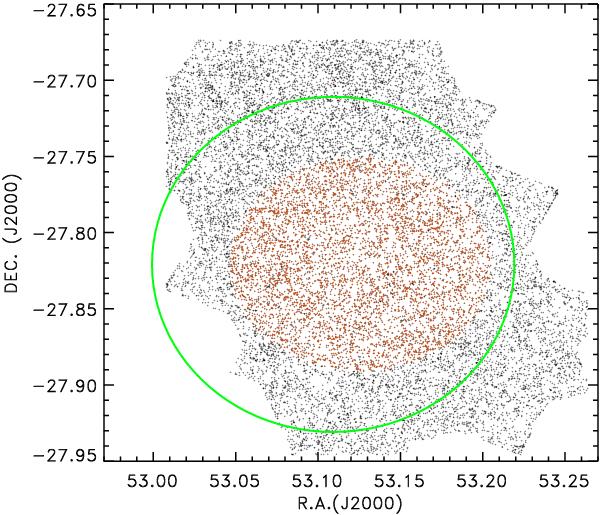
Black dots are the 18 296 sources from Grazian et al. (2006) catalog. The green circle indicates our ROI. Red dots are the 5683 optical/IR sources we used in the spectral analysis.
Current usage metrics show cumulative count of Article Views (full-text article views including HTML views, PDF and ePub downloads, according to the available data) and Abstracts Views on Vision4Press platform.
Data correspond to usage on the plateform after 2015. The current usage metrics is available 48-96 hours after online publication and is updated daily on week days.
Initial download of the metrics may take a while.