Fig. 12
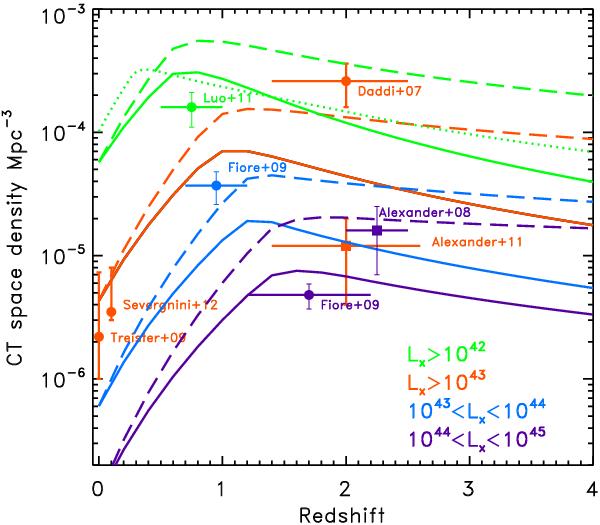
Comoving space density of the CT AGN. We report different results for different redshift and luminosity intervals. Different colors indicate different luminosity bins. Continuous lines show the output of the G07 model; dashed lines represent the same outputs modified by applying a linear positive evolution in redshift. The green dotted line displays the output of the composite model by Draper & Ballantyne (2010).
Current usage metrics show cumulative count of Article Views (full-text article views including HTML views, PDF and ePub downloads, according to the available data) and Abstracts Views on Vision4Press platform.
Data correspond to usage on the plateform after 2015. The current usage metrics is available 48-96 hours after online publication and is updated daily on week days.
Initial download of the metrics may take a while.