Fig. 11
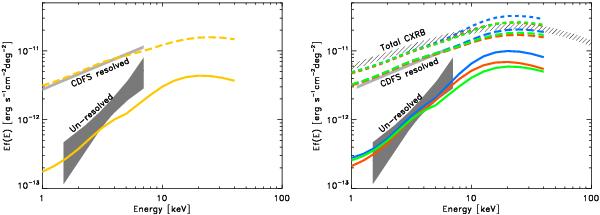
In both panels the dark and light gray areas represent the spectrum of the unresolved and resolved CXRB, respectively. Left panel: the yellow dashed and continuous lines show the expectations of the G07 model for the two components. Right panel: the shaded area represents the total CXRB emission. Blue lines show the G07 model output with the CT (any z, any L, nH > 24) contribution enhanced by a factor 2. Green lines show the G07 model with the only heavily CT contribution enhanced by a factor 5. Red lines show the case where the contribution of high z CT has been enhanced assuming a linear evolution with redshift. Continuous, long-dashed, and short-dashed lines are for CDFS unresolved, CDFS resolved, and total CXRB, respectively.
Current usage metrics show cumulative count of Article Views (full-text article views including HTML views, PDF and ePub downloads, according to the available data) and Abstracts Views on Vision4Press platform.
Data correspond to usage on the plateform after 2015. The current usage metrics is available 48-96 hours after online publication and is updated daily on week days.
Initial download of the metrics may take a while.