Fig. 10
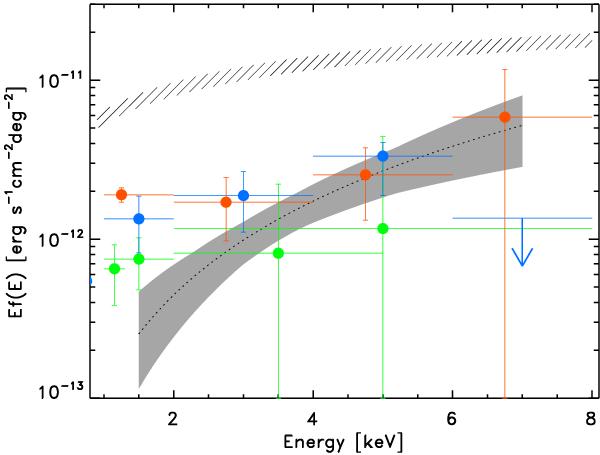
Spectrum of the unresolved CXRB: comparison with previous measures. The gray area is the result of the present work. Green points are from Hickox & Markevitch (2007); blue points are from Luo et al. (2011), with the blue arrow indicating the 1σ upper limit; red points from Worsley et al. (2006). The dashed area represents the total CXRB emission as measured by Swift (Moretti et al. 2009).
Current usage metrics show cumulative count of Article Views (full-text article views including HTML views, PDF and ePub downloads, according to the available data) and Abstracts Views on Vision4Press platform.
Data correspond to usage on the plateform after 2015. The current usage metrics is available 48-96 hours after online publication and is updated daily on week days.
Initial download of the metrics may take a while.