Fig. 8
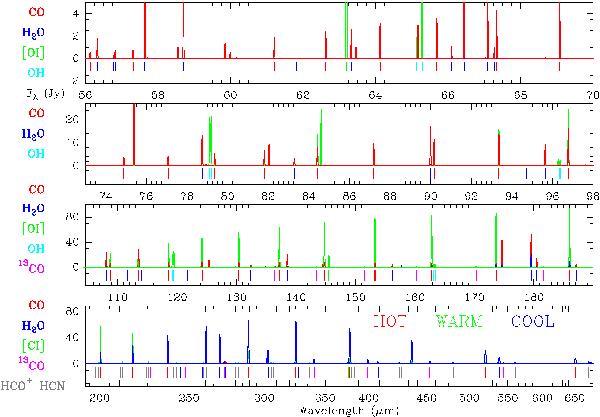
Synthetic non-LTE LVG spectrum of the Class 0 protostar Serpens MM1 convolved to PACS (top three panels) and SPIRE (lower panel) spectral resolutions. Continuous curves show the line emission contribution from the “hot” (red), “warm” (green) and “cool” (blue) components discussed in the text. Vertical labels mark the wavelength position of CO (red), H2O (blue), OH (cyan), 13CO (magenta), HCO+ and HCN (grey) rotational transitions. [O i]63, 145 and [C i]370, 609 μm fine structure lines are marked with green labels.
Current usage metrics show cumulative count of Article Views (full-text article views including HTML views, PDF and ePub downloads, according to the available data) and Abstracts Views on Vision4Press platform.
Data correspond to usage on the plateform after 2015. The current usage metrics is available 48-96 hours after online publication and is updated daily on week days.
Initial download of the metrics may take a while.