Fig. 4
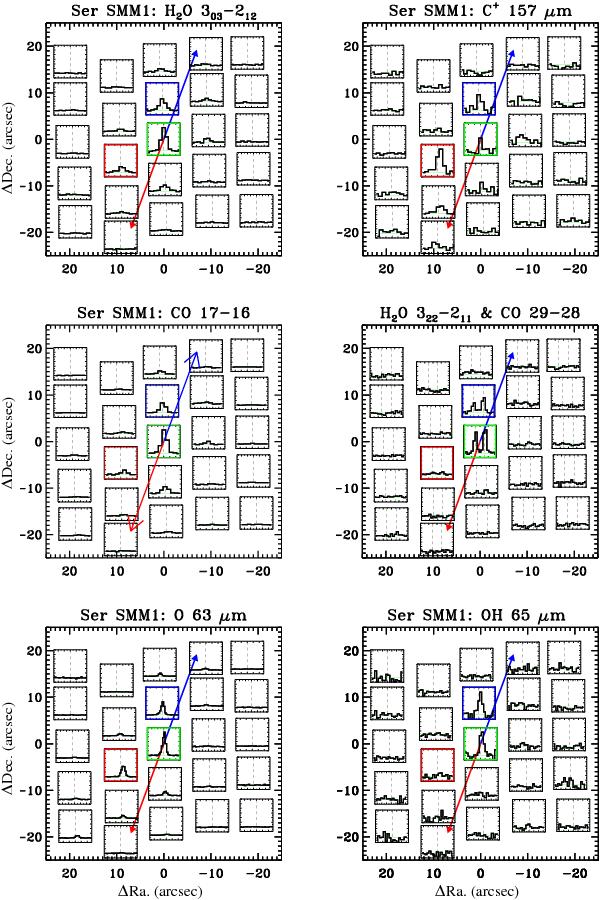
PACS spectral maps of Serpens SMM1 in the o-H2O
303–212 (174.626 μm);
[C ii]157.741 μm; CO J = 17−16
(153.267 μm); both
p-H2O 322–211
(89.988 μm) and CO J = 29−28
(90.163 μm); [O i]63.183 μm and OH
 J =
9/2+–7/2− (65.279 μm) lines (from
top to bottom). The center of each spaxel corresponds to its offset
position with respect to the protostar
at α2000: 18h29m49.8s,
δ2000: 1°15′20.5′′.
The Y-axis for each transition represents the normalized line flux
(in the −0.2 to 1.2 range) with respect to the brightest line in the array. The
X-axis represents the −550 to 550 km s-1 velocity
scale except for the OH 65.279 μm line
(− 350 to 350 km s-1) and the p-H2O
89.988 μm and CO 90.163 μm lines
(− 1000 to 1000 km s-1). The vertical dashed lines show the position
of the rest wavelengths. Blue and red arrows show the approximated outflow
direction. The green box represents the central spaxel centered at the protostar
position whereas the red and blue boxes represent postions in the red and blue
outflow lobes respectively. Note that the PSF is relatively constant for
λ ≲ 100 μm (FWHM ≃
spaxel size ≃9.4′′) but increases at longer wavelengths.
J =
9/2+–7/2− (65.279 μm) lines (from
top to bottom). The center of each spaxel corresponds to its offset
position with respect to the protostar
at α2000: 18h29m49.8s,
δ2000: 1°15′20.5′′.
The Y-axis for each transition represents the normalized line flux
(in the −0.2 to 1.2 range) with respect to the brightest line in the array. The
X-axis represents the −550 to 550 km s-1 velocity
scale except for the OH 65.279 μm line
(− 350 to 350 km s-1) and the p-H2O
89.988 μm and CO 90.163 μm lines
(− 1000 to 1000 km s-1). The vertical dashed lines show the position
of the rest wavelengths. Blue and red arrows show the approximated outflow
direction. The green box represents the central spaxel centered at the protostar
position whereas the red and blue boxes represent postions in the red and blue
outflow lobes respectively. Note that the PSF is relatively constant for
λ ≲ 100 μm (FWHM ≃
spaxel size ≃9.4′′) but increases at longer wavelengths.
Current usage metrics show cumulative count of Article Views (full-text article views including HTML views, PDF and ePub downloads, according to the available data) and Abstracts Views on Vision4Press platform.
Data correspond to usage on the plateform after 2015. The current usage metrics is available 48-96 hours after online publication and is updated daily on week days.
Initial download of the metrics may take a while.