Fig. 3
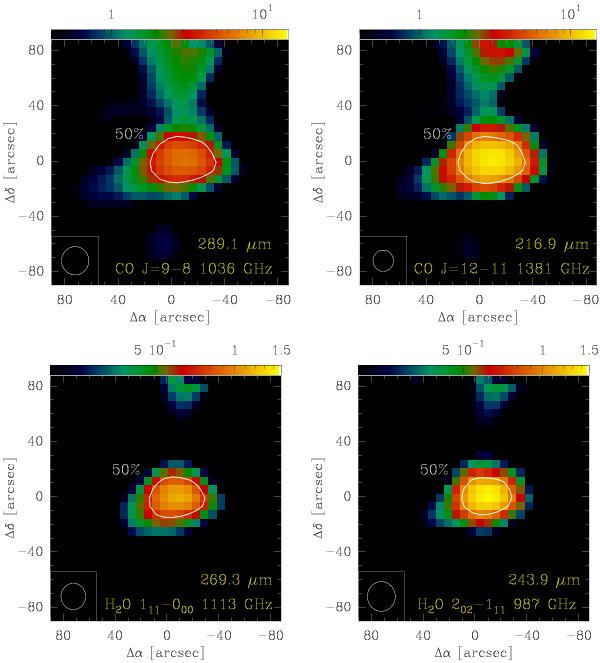
Upper: SPIRE-FTS 12CO J = 9−8 and 12−11 sparse maps. Lower: p-H2O 111–000 and 202–111 maps respectively. The line surface brightness is on the 10-8 W m-2 sr-1 scale. The white contours represent the 50% line emission peak level. The FWHM beam is shown in each inset. Note the increase of line surface brightness in the more excited lines.
Current usage metrics show cumulative count of Article Views (full-text article views including HTML views, PDF and ePub downloads, according to the available data) and Abstracts Views on Vision4Press platform.
Data correspond to usage on the plateform after 2015. The current usage metrics is available 48-96 hours after online publication and is updated daily on week days.
Initial download of the metrics may take a while.