Fig. 2
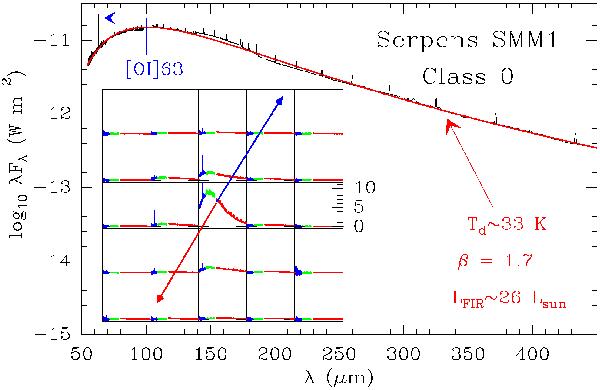
Observed spectral energy distribution (SED) of Serpens SMM1 and modified blackbody fit (red curve). Inset shows the full PACS array in flux density units of 10-14 W m-2 μm-1. The abscissa is in linear scale from 55 to 190 μm. The bright emission line seen in several positions is [O i]63 μm. Approximate outflow directions are shown with red and blue arrows.
Current usage metrics show cumulative count of Article Views (full-text article views including HTML views, PDF and ePub downloads, according to the available data) and Abstracts Views on Vision4Press platform.
Data correspond to usage on the plateform after 2015. The current usage metrics is available 48-96 hours after online publication and is updated daily on week days.
Initial download of the metrics may take a while.