Fig. A.1
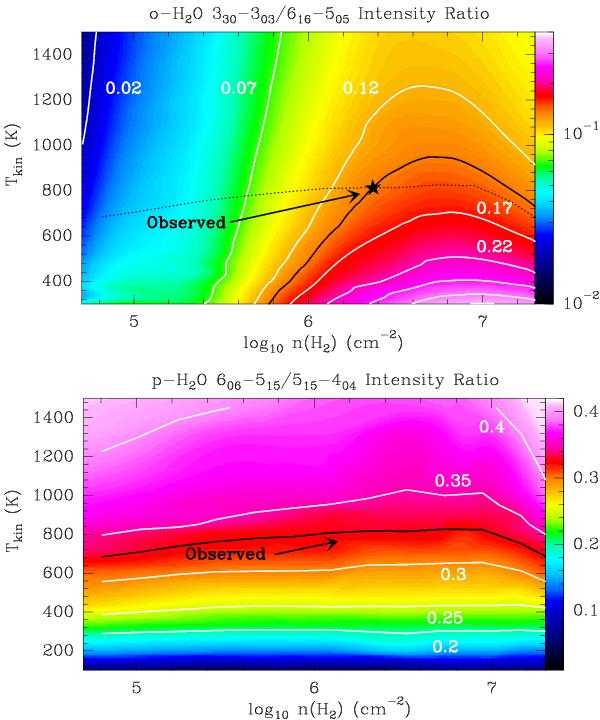
Grid of H2O LVG models for different gas temperatures and densities. Bottom: contour levels of the p-H2O 606–515/515–404 (83.284/95.627 μm) line ratio for N(p-H2O) = 1016 cm-2. Note the gas temperature dependence of this ratio. The black continuous curve shows the observed intensity line ratio of 0.33. Top: contour levels of the o-H2O 330–303/615–305 (67.269/82.031 μm) ratio for N(o-H2O) = 3 × 1016 cm-2. Note the gas density dependence of this ratio. The black continuous curve shows the observed intensity line ratio of 0.14 while the black dotted curve shows the observed p-H2O 606–515/515–404 ratio. The intersection of both curves is marked with a star (see text).
Current usage metrics show cumulative count of Article Views (full-text article views including HTML views, PDF and ePub downloads, according to the available data) and Abstracts Views on Vision4Press platform.
Data correspond to usage on the plateform after 2015. The current usage metrics is available 48-96 hours after online publication and is updated daily on week days.
Initial download of the metrics may take a while.