Fig. 2
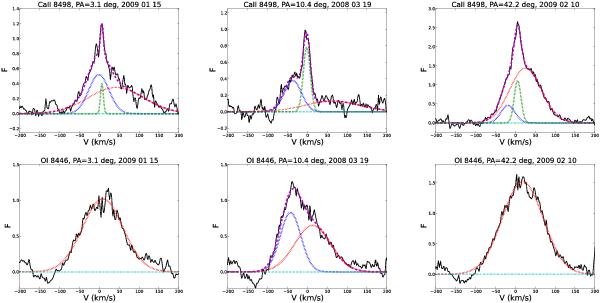
Emission lines of Ca II λ8498 (top row) and O I λ8446 (bottom row) in UVES spectra of ISO 143 at different observing times in Mar. 2008, Jan. 2009, and Feb. 2009 in the order of increasing slit PA after continuum subtraction. The flux is given in arbitrary units. Gaussian fitting shows that the Ca II line can be decomposed into three components: (i) a narrow one centered close to zero velocity (probably chromospheric, green dotted line), (ii) a broader blue-shifted one (possibly produced in a wind, blue dotted line), and (iii) a very broad red-shifted one (possibly produced in magnetospheric infall, red dotted line). The pink dashed line is the sum of the Gaussian functions. The O I line can be fitted by a single red-shifted component in the two spectra from 2009 and by a blue- and a red-shifted component in the spectrum from 2008 (the pink dashed line denotes here the sum of the two Gaussian functions).
Current usage metrics show cumulative count of Article Views (full-text article views including HTML views, PDF and ePub downloads, according to the available data) and Abstracts Views on Vision4Press platform.
Data correspond to usage on the plateform after 2015. The current usage metrics is available 48-96 hours after online publication and is updated daily on week days.
Initial download of the metrics may take a while.