Fig. 6
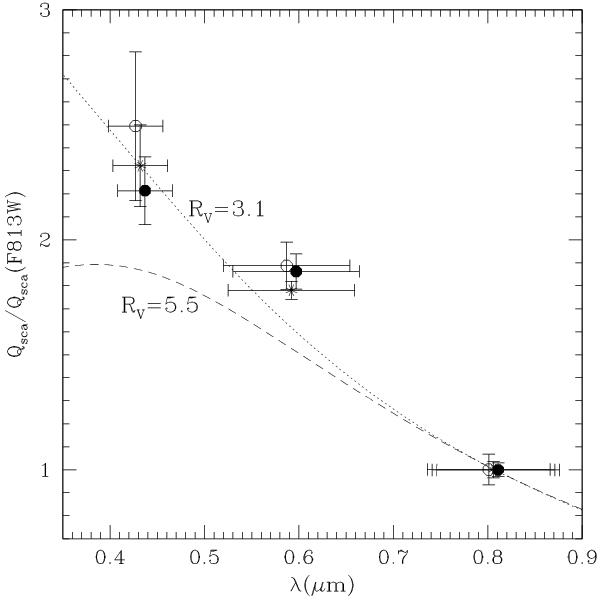
Dependence of the scattering coefficient, Qsca, on the wavelength as derived from modelling of the echo. The values are normalized to Qsca at the effective wavelength of the F814W filter. Asterisks: results of the models fitting the total flux, STmag, (upper rows in Table 2). Open circles: results of the models fitting the mean surface brightness, Sb, (middle rows in Table 2). Filled circles: results of the models fitting the mean surface brightness derived from the brightest pixels filling fc = 0.5, SB 0.5, (bottom rows in Table 2). The horizontal error bars represent the widths of the photometric bands. Open and filled symbols are shifted by ± 0.05 μm in the abscissa axis for clarity. Curves: relations expected from modelling the interstellar extinction curve of Weingartner & Draine (2001) for RV = 3.1 (dotted) and RV = 5.5 (dashed).
Current usage metrics show cumulative count of Article Views (full-text article views including HTML views, PDF and ePub downloads, according to the available data) and Abstracts Views on Vision4Press platform.
Data correspond to usage on the plateform after 2015. The current usage metrics is available 48-96 hours after online publication and is updated daily on week days.
Initial download of the metrics may take a while.