Fig. 4
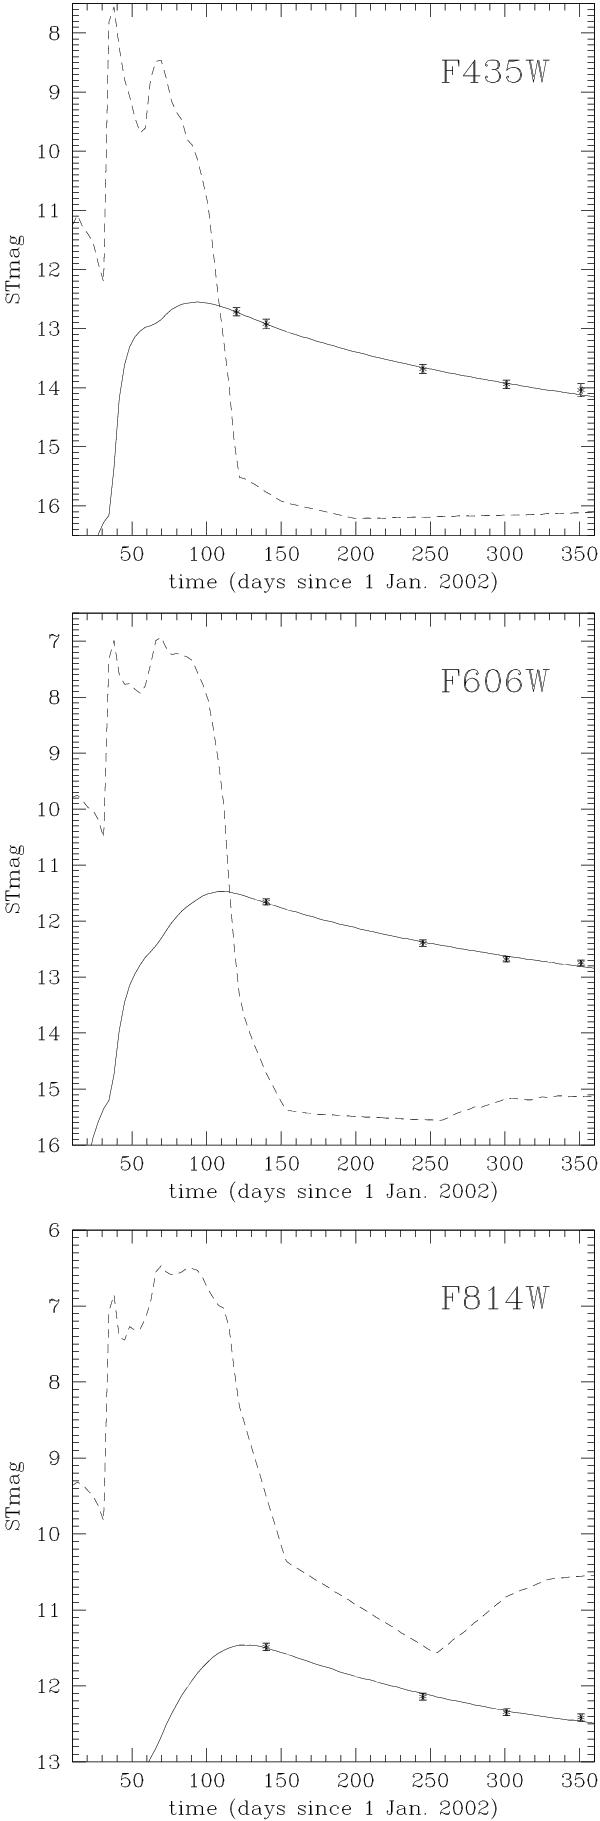
Evolution of the light-echo total-flux in the ST magnitude scale as observed in the F435W (upper panel), F606W (middle panel), and F814W (bottom panel) filters. Dashed curve: observed light curve of V838 Mon. Asterisks: observed light-echo magnitudes (Col. 7 in Table 1). Full curve: best fit of the modelled evolution to the observational points. Parameters of the fit can be found in Table 2 upper rows.
Current usage metrics show cumulative count of Article Views (full-text article views including HTML views, PDF and ePub downloads, according to the available data) and Abstracts Views on Vision4Press platform.
Data correspond to usage on the plateform after 2015. The current usage metrics is available 48-96 hours after online publication and is updated daily on week days.
Initial download of the metrics may take a while.