Fig. 6
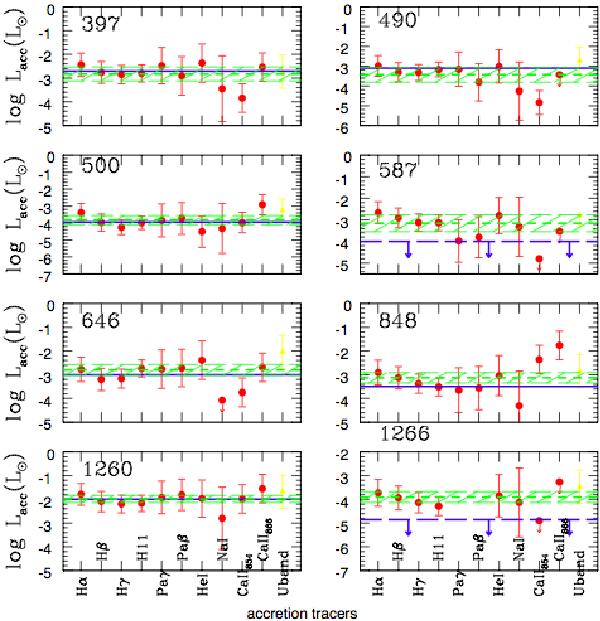
Comparison between all accretion indicators listed in Table 6. The red dots are our estimates of the accretion luminosity, the red arrows are the upper limits, the yellow triangles refer to Lacc obtained from the U-band excess emission, which was observed non-simultaneously with the other indicators. The green dashed line is the average Lacc,l computed considering all secondary indicators; the green shaded region is the 1σ uncertainty in the average Lacc,l. The blue line is Lacc,c obtained using the excess continuum emission (dashed blue line for the upper limits).
Current usage metrics show cumulative count of Article Views (full-text article views including HTML views, PDF and ePub downloads, according to the available data) and Abstracts Views on Vision4Press platform.
Data correspond to usage on the plateform after 2015. The current usage metrics is available 48-96 hours after online publication and is updated daily on week days.
Initial download of the metrics may take a while.