Fig. 9
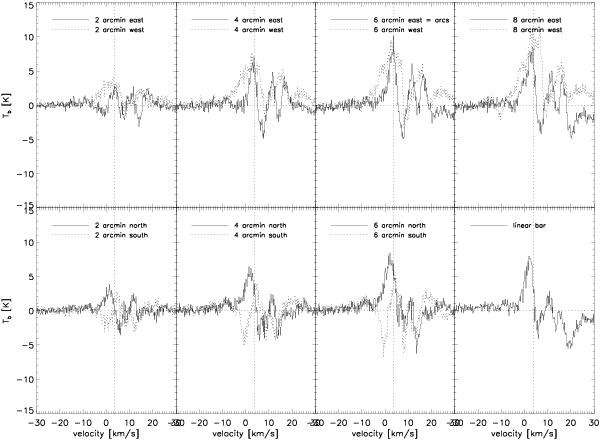
α Ori spectra H i spectra obtained by taken the off-positions in different directions (as indicated in each panel). The offset position at 6′ to the east is situated in the arc detected with Herschel. The right bottom panel shows the spectrum when the offset position is taken in the linear bar. The vertical line marks the CO vLSR of Betelgeuse.
Current usage metrics show cumulative count of Article Views (full-text article views including HTML views, PDF and ePub downloads, according to the available data) and Abstracts Views on Vision4Press platform.
Data correspond to usage on the plateform after 2015. The current usage metrics is available 48-96 hours after online publication and is updated daily on week days.
Initial download of the metrics may take a while.