Fig. D.1
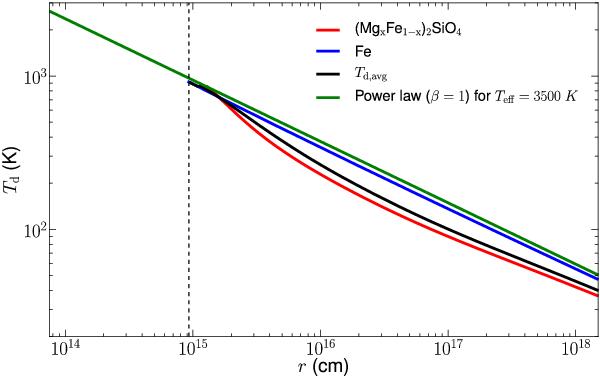
The dust-temperature profiles in the envelope of Betelgeuse as modeled with mcmax (Min et al. 2009). The different lines indicate the dust temperature of a specific dust species: red for amorphous silicates and blue for metallic iron. The full black line gives the mean dust temperature profile, assuming thermal contact between iron and amorphous silicate grains. The green lines show a power-law distribution for the dust temperature for β = 1. The vertical dashed line indicates the inner radius of the dust shell.
Current usage metrics show cumulative count of Article Views (full-text article views including HTML views, PDF and ePub downloads, according to the available data) and Abstracts Views on Vision4Press platform.
Data correspond to usage on the plateform after 2015. The current usage metrics is available 48-96 hours after online publication and is updated daily on week days.
Initial download of the metrics may take a while.