Fig. A.2
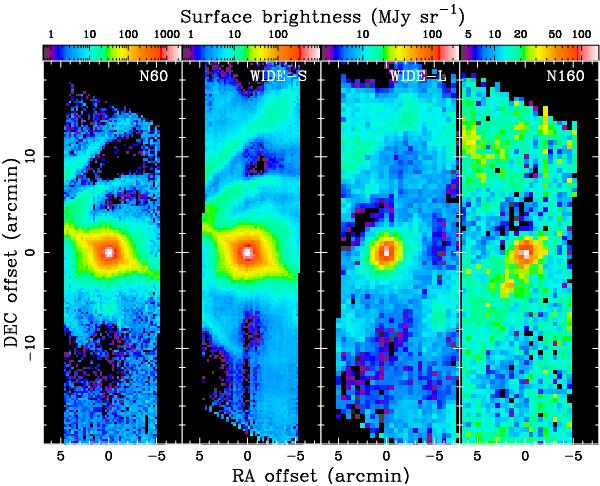
AKARI/FIS false-colour maps of α Ori in the SW bands – N60 (65 μm) and WIDE-S (90 μm) at 15′′/pixel scale – and in the LW bands – WIDE-L (140 μm) and N160 (160 μm) at 30′′/pixel scale – from left to right, respectively (Ueta et al. 2008). Background emission has been subtracted by a combination of temporal filters during data reduction. RA and Dec offsets (with respect to the stellar peak) are given in arcminutes. The wedges at the top indicate the log scale of surface brightness in MJy sr-1. North is up, and east to the left.
Current usage metrics show cumulative count of Article Views (full-text article views including HTML views, PDF and ePub downloads, according to the available data) and Abstracts Views on Vision4Press platform.
Data correspond to usage on the plateform after 2015. The current usage metrics is available 48-96 hours after online publication and is updated daily on week days.
Initial download of the metrics may take a while.