Fig. 14
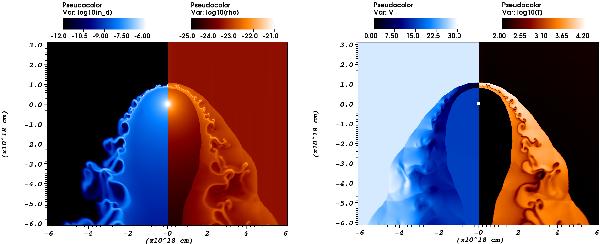
The dust particle density [cm3] and gas density [g cm-3] (left); and the gas velocity [km s-1] and gas temperature [K] (right) for a simulation with an ambient medium temperature of 100 K (simulation A). Although the shocks are smooth, the contact discontinuity shows extensive instabilities, which start small at the front of the shock and grow as they move downstream. The dust concentration follows the contact discontinuity.
Current usage metrics show cumulative count of Article Views (full-text article views including HTML views, PDF and ePub downloads, according to the available data) and Abstracts Views on Vision4Press platform.
Data correspond to usage on the plateform after 2015. The current usage metrics is available 48-96 hours after online publication and is updated daily on week days.
Initial download of the metrics may take a while.