Free Access
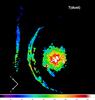
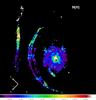
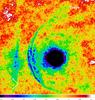
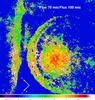
Fig. 13
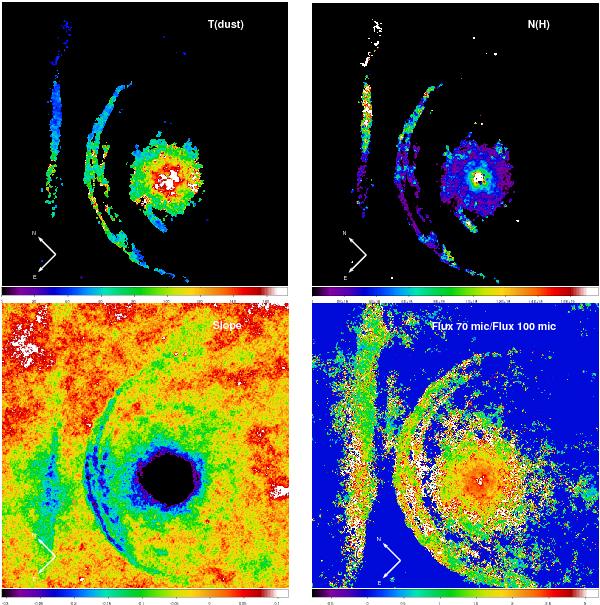
Dust temperature [K] (β = 1, upper left), hydrogen column density [cm2] (upper right), slope of the linear fit to the flux values at 70, 100, and 160 μm (bottom left), and ratio between the flux values at 70 and 100 μm (bottom right) as derived from the Herschel PACS images. See text for more details.
This figure is made of several images, please see below:
Current usage metrics show cumulative count of Article Views (full-text article views including HTML views, PDF and ePub downloads, according to the available data) and Abstracts Views on Vision4Press platform.
Data correspond to usage on the plateform after 2015. The current usage metrics is available 48-96 hours after online publication and is updated daily on week days.
Initial download of the metrics may take a while.