Free Access
Fig. 11
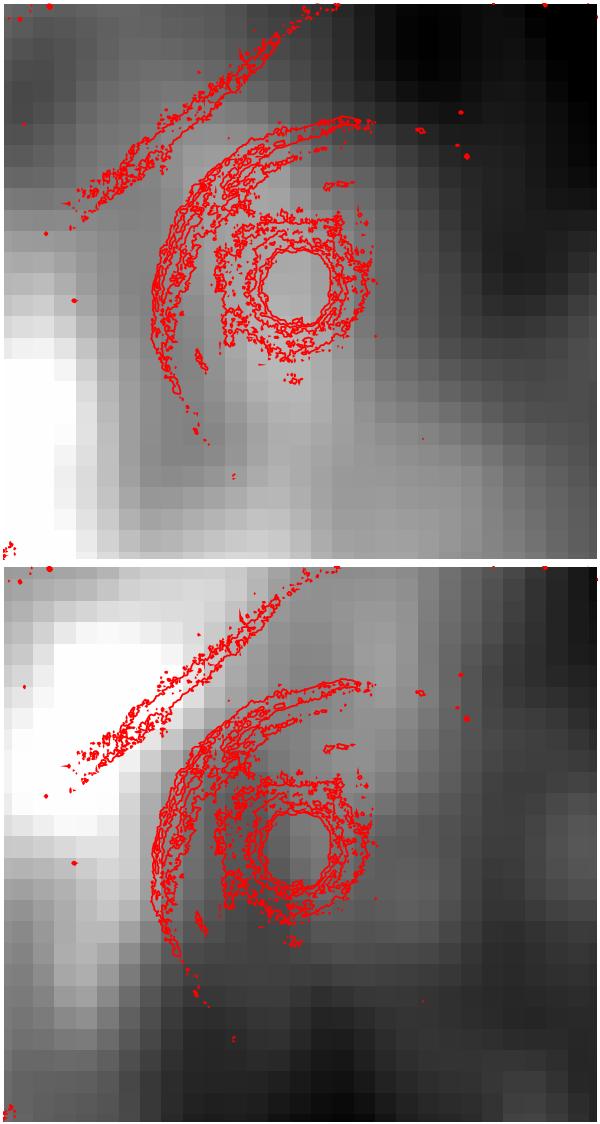
Comparison between the GALFA-HI emission, summed from − 1.472 to 8.832 km s-1 (top) and from 17.848 to 21.528 km s-1 (bottom), and the 0.3 mJy contours of the PACS 70 μm image.
Current usage metrics show cumulative count of Article Views (full-text article views including HTML views, PDF and ePub downloads, according to the available data) and Abstracts Views on Vision4Press platform.
Data correspond to usage on the plateform after 2015. The current usage metrics is available 48-96 hours after online publication and is updated daily on week days.
Initial download of the metrics may take a while.