Fig. 4
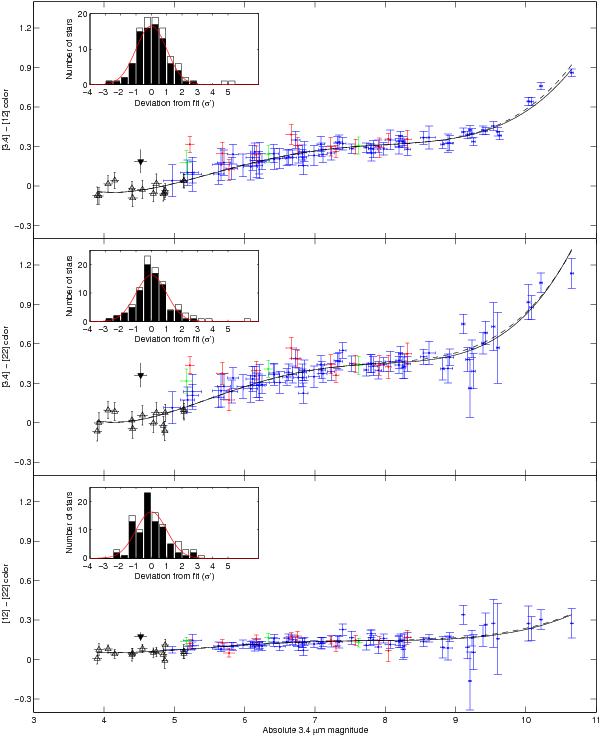
WISE colors plotted against 3.4 μm absolute magnitude. Single M-dwarfs are blue, binary systems are marked in red, triple systems in green. The black open triangles show the K dwarfs included to better constrain the high-mass end of the fit. The black dashed line shows the third-order polynomial fit using all single dwarfs, while the black solid line shows the fit after iteratively removing outliers and is used for our analysis. The inset shows the histogram for the σ′ error value adopted for our analysis (see definition in the text). The solid bars represent the stars that were used in the fit, the blank stacked bars are for the stars that were omitted from the fit (multiples and outliers). In all three cases, the histograms are consistent with a standard-normal distribution (plotted here as a red line). For reference and as test of our technique, the black filled downward triangle to the left represents the well-known excess source AU Mic, which seems to have significant excess in all three colors. For a discussion of AU Mic, see Sect. 3.8.
Current usage metrics show cumulative count of Article Views (full-text article views including HTML views, PDF and ePub downloads, according to the available data) and Abstracts Views on Vision4Press platform.
Data correspond to usage on the plateform after 2015. The current usage metrics is available 48-96 hours after online publication and is updated daily on week days.
Initial download of the metrics may take a while.