| Issue |
A&A
Volume 548, December 2012
|
|
|---|---|---|
| Article Number | A14 | |
| Number of page(s) | 11 | |
| Section | Planets and planetary systems | |
| DOI | https://doi.org/10.1051/0004-6361/201219710 | |
| Published online | 14 November 2012 | |
Rotational motion of Phobos
1
Université Pierre et Marie Curie, UPMC,
Paris 06,
France
2
IMCCE, Observatoire de Paris, CNRS UMR 8028,
77 avenue Denfert-Rochereau,
75014
Paris,
France
e-mail: This email address is being protected from spambots. You need JavaScript enabled to view it.
3
Jet Propulsion Laboratory, Caltech, Pasadena, USA
e-mail: This email address is being protected from spambots. You need JavaScript enabled to view it.
4
Royal Observatory of Belgium, 3 Avenue Circulaire, 1180
Brussels,
Belgium
e-mail: This email address is being protected from spambots. You need JavaScript enabled to view it.
; This email address is being protected from spambots. You need JavaScript enabled to view it.
Received:
29
May
2012
Accepted:
10
September
2012
Abstract
Context. Phobos is in synchronous spin-orbit resonance around Mars, like our Moon around the Earth. As a consequence, the rotational period of Phobos is equal in average to its orbital period. The variations of its rotational motion are described by oscillations, called physical librations, which yield information of its interior structure. The largest libration of Phobos rotational motion was first detected in 1981 and the determination of this libration has recently been improved using Mars EXpress observations.
Aims. The objective of this paper is to present the spectrum of Phobos’ librations by using recent orbital ephemerides and geophysical knowledge of this Martian satellite. The analysis of the librational spectrum highlights the relationship between dynamical and geophysical properties of the body, but is also useful for cartographic and geodetic purposes for future space missions dedicated to Phobos.
Methods. We developed a numerical model of Phobos’ rotation that includes the point-mass Mars acting on the dynamical shape of Phobos, expanded to the third degree, and the effect of Mars’ oblateness. The forced librations spectrum is extracted through a frequency analysis.
Results. We find that the libration in longitude presents a quadratic term that coincides with the secular acceleration of Phobos falling onto Mars. The primary libration in longitude has a period equal to the anomalistic mean motion, whereas the primary libration in latitude has a period equal to the draconic mean motion (node to node). Both librations have amplitudes of about one degree leading to a surface displacement of about 200 m. These two components dominate the libration spectrum by a factor one hundred. Phobos’ third degree gravity harmonics and Mars’ oblateness affect the librations amplitude at 10-4 degree. This is small but detectable from long-term tracking of a lander. The determination of the librational spectrum would bring strong constraints on the principal torques acting on the Martian moon, as well as on the possible presence of lateral variations in density predicted by certain geophysical models of the Stickney crater formation. We also investigate the obliquity variations of Phobos and find that their amplitudes are larger than the mean value of the obliquity.
Conclusions. Phobos exhibits a rich and varied set of librational oscillations. The main librations and the librations close to the proper frequencies are the most sensitive to the interior structure. On the other hand, the superimposed effect of large amplitude oscillations is likely to make the determination of the mean obliquity challenging.
Key words: celestial mechanics / planets and satellites: dynamical evolution and stability / planets and satellites: individual: Phobos
© ESO, 2012
1. Introduction
We introduce a model of Phobos’ rotation that includes a detailed description of the dependence of the librations on interior properties, Mars’ oblateness, and Phobos’ degree three gravity component. This study is motivated by emerging mission concepts aiming at high-accuracy measurements of Phobos’ rotation. A major objective of these missions is to infer constraints on Phobos’ internal structure from variations in the rotation, called librations.
Such a technique has been used with success to obtain interior properties of planetary bodies (e.g. Williams et al. 2001; Margot et al. 2007) and for analyzing the Earth interior properties (Mathews et al. 2002). The rotational motion of Phobos was first determined in 1981 by Duxbury and Callahan by using Viking orbiter images, which led to dynamical studies of Phobos’ librations (Borderies & Yoder 1990; Chapront-Touzé 1990; Pesek 1991). Recently Willner et al. (2010) have increased the number of control points by using Mars EXpress (MEX) high-resolution images. These authors determined the libration amplitude at 1.20 degree (deg) with an accuracy of about 0.15 deg. This measurement is consistent with the 1.1 deg that they deduced from the shape model and the 1.03 ± 0.22 deg of Jacobson (2010) determined from the orbital motion of Phobos. The amplitude of the libration in longitude gives a relative moment of inertia γ = (B − A)/C, with  the moments of inertia, equal to 0.1365 for the 1.2 degree libration or 0.1295 for the 1.1 degree libration. However, the prospects for increased refinement of the MEX image analysis as well as for future missions dedicated to Phobos (e.g. Turyshev et al. 2010; Oberst et al. 2011; Michel et al. 2011) motivate this new study of the librational motion of Phobos and the description of its libration spectrum as described in the next section. In Sect. 3, we present the model by dividing the inputs: interior and ephemerides from the rotational model. Then, the librational motion spectrum is presented in Sect. 4. Finally, we discuss our results in the perspective of future space missions and conclude.
2. Motivation
2.1. Predicting high-resolution measurements of Phobos’ rotation
Phobos is in spin-orbit synchronous resonance around Mars, i.e., on average it shows the same face toward Mars. The nonzero eccentricity results in variations in the orbital speed so that the satellite presents 52% of its surface to Mars (for comparison, the Moon displays 59% of its surface to Earth). Consequently, Mars raises a time-dependent gravitational torque that affects Phobos’ rotation. This response is expressed in the form of physical librations, which are periodic variations around a uniform rotational motion. The librational response depends on the distribution of mass inside the moon, and consequently the physical librations of Phobos bear the signature of its internal structure.
The librational motion of Phobos has been much studied in the 90’s especially in preparation for the Russian mission Phobos 2. Borderies & Yoder (1990), Chapront-Touzé (1990), and Pesek (1991) have developed analytical theories and computed the physical librations of Phobos. These authors used the moments of inertia derived from the analysis of the Viking images by Duxbury (1989), while the orbital ephemeris comes from Chapront-Touzé’s (1988) theory called ESAPHO for “Éphéméride Semi-Analytique de PHObos”. Here, we investigate the rotational motion of Phobos by using a numerical integration to explore couplings that are non-linear or generally neglected from the analytical developments. In addition, we used both the recent determination of the moments of inertia based on MEX images (Willner et al. 2010) and the numerical ephemerides of Lainey et al. (2007).
Since then, recent analyses (e.g., Turyshev 2010; Le Maistre et al. 2012) have demonstrated that laser measurements or a mission similar to Phobos-Soil (Doppler and Star-Tracker measurements) would yield the librations spectrum with an accuracy of about 10-4 degrees. This prompted us to revisit the modeling of Phobos’ rotation motion to assess what new information could be gained from such a high accuracy. As advocated by Turyshev et al. (2010, p. 231), “Numerically integrated physical librations would need to be developed for millimeter data analysis”. This prospect calls for a refined modeling of Phobos’ rotation with increased fidelity. Here, we investigate the impact of effects such as the torque caused by Phobos’ degree three gravity component or the dynamical oblateness of Mars (see Sects. 4.5 and 4.6).
2.2. Phobos interior
Phobos’ internal structure is poorly constrained. The bulk density of 1.879 g/cm3 (Andert et al. 2010) cannot be unambiguously interpreted in terms of composition and porosity (e.g., Rosenblatt 2011). Despite observations by multiple optical remote sensing instruments (near- and thermal infra-red), no firm constraints on the composition, and especially the presence of water (free or in the form of water of hydration) are available yet.
An object of Phobos’ size (~22 km of mean diameter) is expected to be globally homogeneous in composition, whatever its origin. However, heterogeneities inside Phobos cannot be ruled out based on the measured libration angle by Willner et al. (2010). Assuming Phobos is made of a mixture of porosity (macro-porosity or micro-porosity), Rosenblatt et al. (2011) have proposed models of heterogeneous internal mass distribution inside Phobos, which can fit its bulk density and librational angle. Numerical models suggest that the formation of Stickney could have produced extensive macroporosity (Asphaug et al. 2002) in an otherwise coherent material. That porosity should result in a relative decrease in density in that region. On the other hand, a rubble-pile model is less likely to preserve craters and other large-scale features, such as macroporosity (e.g., Michel et al. 2009). Hence, the observation of lateral variations in density may provide clues on the origin of the moon. The signature of lateral density variations on Phobos’ rotational motion is presented in more detail in Sect. 4.7.
3. Modeling framework
3.1. Geophysical model
The librational motion depends mainly on the relative moment of inertia defined as  and
and  , we recall that A,B, and C are the principal moments of inertia of Phobos. To compute the librations, we used the moments of inertia determined by Willner et al. (2010) from the MEX topography mapping of Phobos. In this model the density is homogenous inside Phobos and the values of the moments of inertia are listed in Table 1. We note that the mean moment of inertia
  is equal to 0.43, higher than the 2/5 bound of a homogeneous sphere. To preserve the normalization at 2/5 for the triaxial ellipsoid, the mean radius has to be modified according to Yoder (1995) as
  where (a,b,c) are the length of axis of the ellipsoid. In this case the equivalent radius is R0 = 11.27 km and not the 10.9558 km used in Willner et al. (2010). Table 1 shows the moment of inertia determined by Duxbury (1989) that was used in the Borderies & Yoder (1990) and Chapront-Touzé (1990) studies. The resulting librations are briefly discussed in Sect. 5. The last row of Table 1 presents the Phobos’ moment of inertia derived from a two-density interior model combined with the topographical model of Thomas et al. (1999) that is described in Sect. 4.7.
Main frequencies and periods that describe the orbit of Phobos used in the analysis.
3.2. Orbital model of Phobos
Mars exerts a gravitational torque on Phobos that depends on the relative distance and orientation between the gravitational figure of Phobos and the gravitational figure of Mars. Here, we used the numerical ephemerides of Lainey et al. (2007) to obtain the relative distance between Mars and Phobos. The accuracy of these ephemerides is one kilometer and takes into account the perturbations of the Sun, Jupiter, Saturn, the Earth-Moon system, the gravity field of Mars, and the tidal effects in the Mars-Phobos system. To obtain this accuracy, Lainey et al. used observations acquired from 1877 to 2005, thus combining Earth-ground astrometric measurements and space data from Mars Global Surveyor and Mars EXpress. The reference frame of the numerical ephemerides is the fixed Martian equator at J2000.
To characterize the numerical librations, it is essential to have an analytical description of the orbital motion of Phobos to identify the origin of each libration. Chapront-Touzé (1988, 1990) provided a useful description of the orbit by using the Delaunay arguments (ℓ,ℓ′,D,F) in the mean Martian equator of the date. Following Chapront-Touzé (1990), we call the reference frame defined by the mean Martian equator of the date the ESAPHO reference frame. Then ESAPHO refers to either the orbital analytical ephemerides or the reference frame. The Delaunay arguments are ℓ the mean anomaly of Phobos around Mars, D the angular position of Phobos with respect to the Sun, ℓ′ the mean anomaly of Mars around the Sun, and F the mean position of Phobos with respect to the equator of Mars. In addition, the orbit of Phobos is perturbed by the Sun and a non-spherical Mars, therefore it is necessary to include the mean longitude of the solar pericenter  , and the rotational motion of Mars Ψ. These six arguments provide a high-fidelity description of the orbit of the Martian moon. We list their numerical values in Table 2.
3.3. Rotational model
Like the Moon around Earth, Phobos displays on average the same face toward Mars. Its rotational motion is locked in synchronous spin-orbit resonance. In first approximation, its rotational motion follows the laws established by Cassini (1693) for the Moon. The modern version of these laws has been formulated by Tisserand (1891) and have been generalized to other bodies of the solar system by Colombo (1969), Peale (1969), and specifically for Phobos by Bouquillon et al. (2003). These Cassini laws define several equilibrium states, called Cassini states, and any perturbation of these states generates physical librations, which are the focus of this article.
To compute these librations, we numerically integrated the Euler-Liouville equations of the rotational motion of the satellite around Mars. The advantage of the numerical integration over a purely analytical approach is that it allows the exploration of usually neglected couplings and non-linear effects caused by the proximity of forced and proper frequencies. The dynamical equation governing the rotational motion is the angular momentum balance  (1)where Γ is the total torque acting on Phobos, H is the angular momentum vector of the satellite written as H = [I] ω with ω the instantaneous rotational vector, and [I] the tensor of inertia of the body. The equations are written in a reference frame tied to the body and defined by the orientation of the principal moment of inertia A ≤ B ≤ C, so that [I] is diagonal.
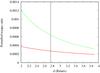 |
Fig. 1 Absolute value of the ratio of the magnitude of the perturbed torques, due to degree 3 (red curve) and due to the Martian oblateness (green curve), over the main torque due to the degree 2 versus the distance of Phobos to Mars. The vertical line marks the actual present distance of Phobos to Mars. |
As Phobos’ shape departs from hydrostatic equilibrium and the satellite is very close to Mars, the resulting torque Γ contains two parts. (1) The main torque Γp due to the gravitational force of a point-mass Mars acting on the dynamical figure of Phobos developed in spherical harmonics until the degree 3:  (2)where M is the mass of Mars, r the relative distance vector of Mars and Phobos, and U the gravitational potential of Phobos developed through spherical harmonics until the degree 3. The amplitude of this torque decreases as a function of (R/a)(n−2), where R is the radius of Phobos, a is the semi-major axis of the orbit of Phobos, and n is the degree of the harmonic (n ≥ 2). Hence, the torque is decreased by a factor of about 10-3 per harmonic degree. (2) A second component of the torque corresponds to the gravitational torque exerted by Mars’ oblateness on Phobos, an effect exacerbated by the short distance between the satellite and its primary (about 9400 km). This torque ΓJ2 may be formally expressed as (e.g. Schutz 1981; Bois et al. 1992)
  (3)where M′ represents the distribution of mass inside Mars and the integration is performed over the Martian volume, l is the relative position between the Martian element dm′ and the center of gravity of Phobos, and U is Phobos’ potential (here developed at the second degree).
Figure 1 shows the ratio of the perturbed degree 3 torque over the main torque due to the degree 2 (red curve) and due to the Martian oblateness torque over the main torque due to the degree 2 (green curve) as function of the distance of Phobos to Mars. First, both perturbed torques appear to be small because their amplitudes are currently below the 0.1% level. Secondly, the magnitude of the torque related to the Martian oblateness is higher than the magnitude of the torque related to the Phobos degree 3 and this difference in amplitude will become more important as Phobos comes closer to Mars.
For the numerical computation, we used the Euler angles defined as the classical sequence 3-1-3 of rotation angles describing the transformation from an inertial reference frame GXYZ, where XY coincides with the mean fixed equator of Mars at J2000 and G the center of mass of Phobos, to the reference frame Gxyz that is tied to Phobos along the axes of principal moment of inertia. The Euler angles are
-
(i)
ψ the precession angle between GX and the node N of the intersection of the inertial plane and the equator plane of Phobos (Gxy);
-
(ii)
the nutation angle θ that is the angle between GZ and Gz;
-
(iii)
the proper rotation ϕ defined as the angle between GN and Gx.
To describe and analyze the librational motion, we used the Martian equator of date, ESAPHO. The Euler angles (ψ,θ,ϕ) expressed in the fixed equator of the Mars reference system were transformed to the Euler angles (ψ′,θ′,ϕ′) expressed with respect to ESAPHO by using the rotation matrix defined in Chapront-Touzé (1990) including the recent angle values from Simon et al. (1994) and Konopliv et al. (2006). Then, the Euler angles are expressed in terms of librations through the Cassini law relationship. The physical libration in longitude τ is defined as  (4)where λ is the mean longitude of Phobos with respect to Mars, and the two components of the unit vector pointing toward the mean pole of the equator of Mars of date in the Phobos body fixed frame are defined as
 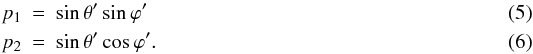 Here, we define our initial conditions by assuming that the amplitudes of the proper modes of the rotational motion of Phobos, also called free librations, are nil. The proper modes correspond to the dynamical oscillations at which the body will librate when its spin is slightly shifted from the dynamical equilibrium position (Rambaux & Williams 2011). For this paper we assumed that the tidal dissipation is strong enough to damp each proper mode and that there is no stimulating mechanism to excite the proper modes. In the case of Phobos, the classical search for initial conditions consisting in removing the contribution of the proper modes to the initial conditions with a frequency analysis (Rambaux et al. 2007; Robutel et al. 2011; Noyelles et al. 2011) does not work because the spectrum shows forced librations with frequencies close to the proper frequencies. Therefore, it is difficult to track the evolution of the amplitude of the proper mode during the reduction process for Phobos. Consequently, to simulate zero-amplitude proper modes, we introduced in our numerical model an artificial damping with a short damping time τd. We integrated over 10 τd and then estimated the initial conditions by integrating backwards without any dissipation. The process was iterated five times with increasing values for τd to converge toward the center of libration, (i.e., with zero amplitude for the proper mode), with a very low damping.
The associated frequencies may be determined by linearizing the Euler-Liouville equations Eq. (1). In the case of a point-mass Mars gravitational torque acting on the figure of Phobos developed to second order, the proper frequencies are (Chapront-Touzé 1990)  where
where 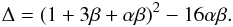 (10)The frequencies ντ,νL and νw correspond to the longitudinal, latitudinal and wobble modes of the rotation, respectively. Note that in the limit where α and β are small, the wobble mode is
  . The factor 2 results from the spin-orbit resonance and is absent in some studies of synchronous satellites. The numerical values of the proper modes expected in our model are listed in Table 3.
4. Rotational response
4.1. Introduction
First, we investigate the main spin-orbit problem, i.e., the gravitational torque exerted by Mars, considered as a point-mass, on the dynamical figure of Phobos developed at the degree 2, i.e. a triaxial body. The signatures of Phobos’ higher order gravity field and Mars’ oblateness are studied in Sects. 4.5 and 4.6, respectively. The impact of these components is weak, justifying the designation of the main spin-orbit problem. Here the orbital motion of Phobos is always the same and is described by the ephemerides of Lainey et al. (2007), regardless of the couplings and torques introduced in the rotational model. We numerically integrated the rotational equations (Eq. (1)) defined in Sect. 3.3 and express the Euler angles in terms of the physical libration in longitude τ and the pole position normal to the Mars’ equator of date (p1, p2).
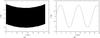 |
Fig. 2 Temporal evolution of the physical libration in longitude τ of Phobos over 40 years a) and 18 h b). The thickness of the line in panel a) is due to rapid oscillations with an amplitude of ± 1 degree at the orbital period of Phobos as shown in panel b). The trend in panel a) is quadratic and corresponds to the tidal evolution of the orbit (semi-major axis decay). |
Fourier series of the oscillations in the τ angle of Phobos with respect to the ESAPHO reference frame.
4.2. Libration in longitude: main problem
The evolution of the angle of libration τ is plotted over 40 years in Fig. 2a. This figure highlights the two components of the libration in longitude: (i) a quadratic term and (ii) periodic oscillations. The quadratic term is equal to 1.27 × 10⁻³ deg/year2, corresponding to the secular acceleration of the orbital motion of Phobos around Mars as a consequence of the tidal decay of its orbit (Lainey et al. 2007). It results from an indirect coupling between the orbit and the spin where the spin-orbit resonance is conserved. This mechanism was previously identified for the Moon (Williams et al. 1978; Bois et al. 1996). Secondly, the thickness of the line in Fig. 2a is spread over ± 1 degree and contains the librational motion that provides the information on the interior properties. The list of librations is detailed below and presented in Table 4.
To characterize the main librations spectrum, we decomposed the librational motion in the frequency domain by using the TRIP software (Laskar 1988, 2005; Gastineau & Laskar 2008). Then, the identification of each term was achieved by comparison with the analytical tables of τ,p1, and p2 provided by Michèle Chapront-Touzé (2011, priv. comm.). Table 4 lists the physical librations that are detected, sorted by decreasing amplitude. The list is truncated at an amplitude of 10-4 degree, corresponding to the order of accuracy expected on geodetic measurements performed with a landed mission, such as Phobos-Soil (Le Maistre et al. 2012). The first librational amplitude dominates the spectrum with an amplitude one hundred times larger than that of the second libration. This libration corresponds to the gravitational coupling at the orbital period of 0.319 days due to the nonzero eccentricity. Its amplitude is equal to 1.0998 degree or 250 m at the surface (using the longest axis of Phobos oriented towards Mars, equal to 13.0 km, Willner et al. 2010). This amplitude obviously agrees with the amplitude given by Willner et al. (2010) since we used the same values for the moments of inertia.
The second physical libration is also related to the nonzero eccentricity of Phobos’ orbit. Because the eccentricity is significant, a second-order theory is necessary to estimate its amplitude analytically (Borderies & Yoder 1990). The analytical calculation yields an amplitude equal to 0.0087 degree that agrees very well with the numerical analysis. The following physical librations are related to perturbations in the orbit stemming either from variations in the eccentricity or from variation in the mean longitude (see Borderies & Yoder 1990, for details).
Now, we describe the results based on the value of the forced frequency ωj with respect to the value of the proper mode ντ as in Rambaux et al. (2010, 2011):
-
1)
The first group concerns the high-frequency librations whereωj > ντ. The amplitudes of the librations are decreased with respect to the magnitude of the orbital variations. That means that the inertia is dominant in the response of the body and that the determination of the amplitude of these librations contains information on interior properties. A similar configuration has already been highlighted for Enceladus and the Galilean satellites (see e.g. Rambaux et al. 2010, 2011).
-
2)
The second group is for the low frequencies where ωj ≪ ντ. At first order in the ratio ωj/ντ, the associated librational amplitudes are equal to the magnitudes of the orbital variations, independently of the moments of inertia. Hence, measuring their amplitudes does not bring any information on the interior. However, it is instrumental to include them in the observation reduction procedure to avoid misleading results.
-
3)
Finally, the third group corresponds to the case where ωj ~ ντ and it is especially interesting for the 10th term of Table 4. This forced libration is close to a secondary resonance between its forced frequency and the proper frequency. The detection of these resonant librations is an additional constraint on the interior of Phobos because it will be possible to determine the period of the proper mode, which depends linearly (in our simplified model, Eq. (7)) on the distribution of mass.
4.3. Libration in latitude: main problem
The physical librations in latitude are described through the pole position normal to Mars’ equator of date. Its variation is shown in Fig. 3. The pole describes an elliptical trajectory and additional oscillations. The radius of the elliptical trajectory is about 220 m, where we scale the librational angle by the mean radius of Phobos, i.e., 11.3 km. As previously, we performed a frequency analysis for p1 and p2 to identify the main librations (Tables 5 and 6). The main large elliptical motion is a libration related to the latitudinal argument F that corresponds to the draconic month, i.e., the node-to-node month. This libration has an amplitude of 1.0788 deg for p1 and 1.0782 deg for p2, corresponding in average to the equatorial inclination of Phobos. Then the following oscillations in Tables 5 and 6 result from perturbations of the orbital inclination of Phobos and variations in F. Their amplitudes are smaller than the first libration by two orders of magnitude. In addition, the amplitude of the 2d, 5th, 8th, and 11th librations for p1 (2d, 6th, 7th, and 10th for p2), are increased by the proximity of a resonance with the proper modes νL and νw (i.e. 27.27 and 7.50 rad/days).
Frequency analysis in p1.
Frequency analysis in p2.
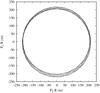 |
Fig. 3 Projection of the polar motion p1,p2 on the sky of Phobos. The angles are multiplied by the mean radius of Phobos, 11.3 km, to display the results in meters. The motion is represented over 2.7 days. |
4.4. Obliquity
The obliquity is defined as the angle between the figure and orbital poles. According to the second Cassini law, the mean value of the obliquity is expected to be constant (Bouquillon et al. 2003). Here, the mean obliquity of Phobos is expected to be 3.6 arcsec by using the relation (Yoder 1995) ![Mathematical equation: \begin{equation} \frac{\mu}{n} \sin{(\eta - i)} = -\frac{3}{2} \sin{\eta} \left[ \frac{(C-A)}{C} \cos{\eta} + \frac{1}{4} \frac{(B-A)}{C} \sin(\eta/2)^2 \right], \label{eq:cassini} \end{equation}](/articles/aa/full_html/2012/12/aa19710-12/aa19710-12-eq120.png) (11)where μ is the precession rate, η the mean obliquity, and i is the inclination of the orbit with respect to the Laplacian plane that coincides with the equatorial plane of Mars at the date (ESAPHO).
(11)where μ is the precession rate, η the mean obliquity, and i is the inclination of the orbit with respect to the Laplacian plane that coincides with the equatorial plane of Mars at the date (ESAPHO).
To analyze the obliquity behavior, Fig. 4 presents the evolution of the orbital and spin poles over one precession period. In this figure, the green line represents the projection of the orbital pole and the red curve is the projection of the figure pole onto the ESAPHO plane. The difference between the two curves is then the instantaneous obliquity projected onto the ESAPHO plane. On average, the two poles precess at the same rate that is verified in the third Cassini law. However, the thickness of the red line in Fig. 4 indicates that the figure pole has a large oscillating amplitude of 165 arcsec, compared to the mean obliquity of 3.6 arcsec, corresponding to a departure from the second Cassini law because of perturbations in Phobos’ orbital motion.
4.5. Higher harmonics couplings
The gravity field of Phobos is only poorly represented by second-degree spherical harmonics and higher degrees are present in its gravity field. Here, we investigate the impact of the higher degree, and especially the degree 3 on its librational spectrum. The set of spherical harmonics coefficients used in this study is presented in Appendix A. The effect of the degree-three harmonics on the rotational motion is a factor (R/a) smaller than the effect of the degree two. Thus, as pointed out by Borderies & Yoder (1990), their impact is expected to be low. However, at the lower bound of our study (10-4 degree) the amplitudes of two physical librations in τ are modified by the presence of the third-degree harmonics as shown in Table 7. These librations are the first and the tenth libration of Table 4. The first libration is modified because its amplitude is the largest and a shift of 0.03% in its amplitude corresponds to an amplitude shift of 3.2 × 10⁻⁴ deg, just detectable at our truncation level. The change in the amplitude of the tenth libration is also strong (about 15%) because the proper resonant frequency is modified by the presence of the third degrees as shown in Borderies & Yoder (1990) ![Mathematical equation: \begin{equation} \nu_{\tau}^2 = 3 n^2 \gamma \left [1 + \left(\frac{R}{a} \right)\frac{ 45 C_{33} - 0.5 C_{31}}{C \gamma} \right], \label{eq:nutauC30} \end{equation}](/articles/aa/full_html/2012/12/aa19710-12/aa19710-12-eq126.png) (12)and the frequency is equal to 12.24 rad/days, i.e. closer to the resonance. In addition to impacting the amplitude, the third-degree gravitational coupling have for consequence to slightly modify the phase of the librations. Therefore, the first and tenth librations have a phase shift of 0.01 and 0.13 deg, respectively. In addition, we note that other librations have phases shifted by up to 0.01 degree. The consequence of the phase shift is that the long axis of Phobos does not exactly point toward Mars at the periastron.
(12)and the frequency is equal to 12.24 rad/days, i.e. closer to the resonance. In addition to impacting the amplitude, the third-degree gravitational coupling have for consequence to slightly modify the phase of the librations. Therefore, the first and tenth librations have a phase shift of 0.01 and 0.13 deg, respectively. In addition, we note that other librations have phases shifted by up to 0.01 degree. The consequence of the phase shift is that the long axis of Phobos does not exactly point toward Mars at the periastron.
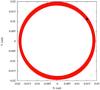 |
Fig. 4 a) Projections of the spin pole (red curve) and orbital pole (green curve) of Phobos during one precession period of 2.32 years. The blue cross and black point indicate the initial conditions for the spin and orbital poles. The difference between the two curves corresponds to the instantaneous obliquity oscillations that oscillates with larger amplitudes than the value of the mean obliquity (see text for details). |
The impact of the third degrees gravitational coupling on the p1 and p2 variables is of the same order of magnitude as for τ and concerns mainly the librations at the orbital frequency and close to the proper frequencies (see Table 7). The affected librations are mainly the 27.15 and 19.69 rad/days librations for p1 and 7.46 and 19.69 rad/days librations for p2. In each case the variations of the first libration are imputed to the proximity of the resonance with an increase of about 1%, whereas the 19.69 rad/days libration presents an increase by 18 and 8% for p1 and p2, respectively. In addition, a constant contribution to p1 from the combination − 1/2C30 + 5C32 in the torque leads to a constant shift of 0.01 degree.
Impact of various sources of perturbations on the librations.
4.6. Mars oblateness coupling
Considering the proximity of Phobos to Mars, we investigated the effect of the Martian oblateness on the rotation of Phobos. Apparently the impact of Mars’ oblateness on the libration in longitude is greater than the impact of the third degree harmonics by a factor 3.5 at maximum. But the resulting effect is still weak. As for the degree 3 harmonics, its effect is significant in the first and the tenth librations for τ. The increase in the librational amplitude is 0.001 and 0.0005 deg, or 0.10 and 34%, respectively. The amplitude of the second term varies owing to its proximity to the resonance since the proper frequency is modified as ![Mathematical equation: \begin{equation} \nu_{\tau}^2 = 3 n^2 \gamma \left [1 + \left(\frac{5 J_2}{2} \right) \left(\frac{R_{\rm mars}}{a} \right)^2\right ], \label{eq:nutauJ2} \end{equation}](/articles/aa/full_html/2012/12/aa19710-12/aa19710-12-eq131.png) (13)the shift in the proper frequency is 6.3 × 10⁻⁴ with respect to the main problem, i.e., almost twice as large as in the previous case (Eq. (12)). The effect on the phases is very weak, below 0.0002 deg, except for the 12.24 rad/days (10th term in Table 7) and the 0.0076 rad/days librations (9th term in Table 7), where the shifts are 0.663 and 0.008%, respectively.
(13)the shift in the proper frequency is 6.3 × 10⁻⁴ with respect to the main problem, i.e., almost twice as large as in the previous case (Eq. (12)). The effect on the phases is very weak, below 0.0002 deg, except for the 12.24 rad/days (10th term in Table 7) and the 0.0076 rad/days librations (9th term in Table 7), where the shifts are 0.663 and 0.008%, respectively.
As shown in Table 7, the coupling with Mars’ oblateness has a negligible impact on the amplitudes of the librations of p1 and p2 except for the p2 libration at 7.46 rad/days (2d term) corresponding to the resonant term. The weakness of the effect in latitude is essentially due to the symmetry of the perturbation, perpendicular to the ESAPHO plane. On the other hand, the effect is much more significant for the phases, reaching 0.1–0.2 degrees for some librations not shown in Table 7.
4.7. Lateral variations in density
In this section we compare the rotational motion computed for two interior models of Phobos: a uniform interior (described in previous sections) and the model presented in Fig. 5 in which there is a contrast in density of about 30% between the region below Stickney and the rest of Phobos. This non-uniform model is motivated by the modeling of the important macroporosity resulting from the formation of Stickney (Asphaug & Melosh 1993). The geometry of the density variation is taken to be spherical and centered at the center of mass of Phobos. We built 60 interior models that verify the mass, topography, and the amplitude of the primary physical libration in longitude of Phobos (i.e. a constraint on γ). Table 1 shows the building model with the larger difference with respect to relative moment of inertia determination α and β from the MEX data. In all models γ is constrained to be in the range of the measured value by the determination of the librational amplitude, i.e., 1.20 ± 0.15 deg.
Table 8 shows the comparison of the libration in longitude coming from the uniform model (Col. 3) and the hetereogenous model developed here (last column called H12). The amplitudes are expressed in 10-6 radians to compare them with the Borderies & Yoder (1990) and Chapront-Touzé (1990) studies (see the discussion in the next section). The primary libration of H12 has an amplitude of 1.33 degree because we present the value obtained for an extreme endmember model. The determination of the primary libration from Willner et al. (2010) is between 1.05 and 1.35 degrees from Willner’s observed libration. For the homogeneous interior, we used the 1.1 degree modeled of Willner et al. (2010). Table 8 shows that the amplitudes of low-frequency librations are the same for the homogeneous and heterogeneous model, whereas the amplitudes of high-frequency librations are largely modified because they strongly depend on the relative moments of inertia. Column H12 shows how important it is to detect the corresponding librations to constrain the interior of Phobos. This result is discussed in more detail in Le Maistre et al. (2012).
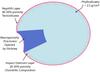 |
Fig. 5 Interior structure model of Phobos. In this model, the impact that formed the Stickney crater has led to macroporosity (Asphaug & Melosh 1993), representing the main source of lateral heterogeneity. The gray part sketches the geometry that we used to compute the lateral heterogeneity, see text for details. Radial heterogeneity comes from a thick outer regolith layer and a high (macro)porosity layer created as a consequence of impacting of the material, but assumed to be laterally homogeneous, except in the region of Stickney. |
5. Discussion
We described the rotational motion of Phobos computed from a numerical integration that has the advantage to account for non-linear effects and their signatures. Elegant analytical theories have been provided by Borderies & Yoder (1990) and Chapront-Touzé (1990). These analytical theories are crucial to identify and characterize the librational spectrum. As shown in Sect. 4, some librations have frequencies very close to the proper frequencies, leading to a strong dependence of their amplitudes on the proper frequencies. The values of the proper frequencies depend on the moment of inertia and on the physical coupling introduced in the model as shown in Eqs. (12) and (13). Therefore the numerical and analytical analysis are highly complementary and necessary to investigate the dynamics of Phobos.
The direct comparison between the analytical studies and our numerical approach has to be made with caution because different moments of inertia and ephemerides have been used in these previous studies, and the physics contained in the models varies from one study to the other. Therefore, we only described the two types of models qualitatively. Table 8 shows the comparison of the libration in longitude coming from Borderies & Yoder (1990, B90), Chapront-Touzé (1990, C90), and from our numerical study. The amplitudes agree well, considering the difference in the values of the parameters (the principal moments of inertia) and ephemerides used in each model. However, we note that in our case, the 12.2485 rad/days libration has a faint amplitude due to the resonant effect with the proper frequency that has not been noticed in the previous analytical studies.
In this paper, we took into account only conservative torques, and the dissipation within Phobos due to the tides will raise an additional torque that tends to slightly change the orientation of the satellite, as shown for Enceladus (see Rambaux et al. 2010). However, the amplitude of that phenomenon is expected to be small, as discussed in detail in Le Maistre et al. (2012).
Below we discuss four approaches for inferring these parameters from rotational measurements: (i) from the libration spectrum, (ii) from the mean obliquity of Phobos, (iii) by focusing on the librations close to proper modes, and (iv) from the orbital variations.
-
i
The first approach consists of relating and verifying thelibrational amplitude spectrum with the interior parameters.This method has been applied with success to the Moon (e.g.Eckhardt 1981, and reference therein). The main libration inτ is a function of the value of the relative moment of inertia γ = (B − A)/C, whereas the main libration in p1 and p2 would constrain β = (C − A)/B (Eckhardt 1981). However, the determination of these two physical parameters is still insufficient to constrain the three moments of inertia (A,B,C). The knowledge of the degree-two gravity coefficients, which are related to the moments of inertia through J2 = (C − (A + B)/2)/MR2 and C22 = (B − A)/4MR2, may allow one to infer C/MR2 from
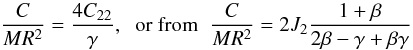 (14)depending on the accuracy of C22 and J2. This, combined with γ and β, would then yield the three moments of inertia. However, the presence of high gravity coefficients for higher degrees deteriorate the accuracy of these methods, which is why a full inversion model with the rotational governing equations is the best approach. That type of model has been developed for the Moon rotation (e.g. Williams et al. 2001).
 -
ii
Another piece of information may be obtained from the measurement of Phobos’ mean obliquity. As shown in Eq. (11), the obliquity is related to the relative moments of inertia (C − A)/C and (B − A)/C, therefore the determination of the mean obliquity leads to a new relationship that can be useful for constraining the polar moment of inertia C/MR2. Figure 6 highlights the relationship between the gravity coefficients and the mean obliquity η. However, the strong oscillating behavior described in Sect. 4.4 is likely to make the determination of the mean obliquity challenging. Measuring that parameter will require one either to accurately model these small oscillations or to smooth observations obtained over 2.5 years (the precession period).
-
iii
Phobos’ rotation has forced frequencies that are close to the proper frequencies for the longitudinal and the latitudinal librations. Therefore the amplitudes of these close forced librations should be enhanced, which possibly offers an avenue for determining the proper periods. As the proper period values are functions of the relative moments of inertia γ, α, and β for the longitudinal and latitudinal modes (see Eqs. (7) to (9)), it is particularly interesting to develop strategies to determine these forced librations. Chapront-Touzé (1990) has listed in her Table 5 the forced librations that could best help identify the proper periods. In addition, a nonzero amplitude of the proper mode cannot be ruled out, as is the case for the Moon (Rambaux & Williams 2010). If such a libration is detected and characterized, it will pose new questions on the mechanism at the origin of this mode.
-
iv
Finally, the physical libration may be determined from an accurate characterization of Phobos’ orbit as shown in Borderies & Yoder (1990) and Jacobson (2010). These aspects were not investigated in the present study.
6. Conclusion
We have modeled Phobos’ rotational motion by computing the gravitational coupling of a point-mass and J2 of Mars acting on the dynamical figure of Phobos developed to the third degree spherical harmonics. This model allows exploring usually neglected geophysical couplings and non-linear effects. We inferred bounds on Phobos’ librations from that calculation.
We showed that the dominant coupling is that due to the point-Mars acting on the dynamical figure of Phobos developed to degree 2, while the perturbations of Mars’ oblateness and Phobos’ third degree gravity are weak, with amplitudes of about 10-4 degree, yet still detectable with dedicated geodetic measurements. Hence we detailed the librational spectrum and highlighted an outstanding signature when forced modes are close to proper modes.
We also briefly discussed different strategies to extract information on the interior from these rotational measurements. Details about these strategies are presented in the Le Maistre et al. (2012) paper, which explores the determination of the librations by combining Doppler tracking and Star Tracker data.
The space missions Viking and Mars EXpress have yielded first-order constraints on the primary libration in longitude of Phobos (Duxbury 1989; Willner et al. 2010), bringing partial information on its interior. To fully take advantage of the relationship between interior and dynamics, a dedicated geodetic mission is necessary, which needs to include in its objectives the measurement of fainter librations (e.g., Turyshev et al. 2010; Oberst et al. 2011). Such an experiment was also part of the science plan for the lost Phobos-Soil mission using a combination of radio science and Star Tracker data (Andreev et al. 2010).
The set of librational spectra computed for this study could be useful for topographic and orientation positioning of Phobos. They are available in electronic form upon request to the lead author.
Acknowledgments
Part of this work has been conducted at the Jet Propulsion Laboratory, California Institute of Technology, under contract to NASA. Government sponsorship acknowledged. Part of this work was financially supported by the Belgian PRODEX program managed by the European Space Agency in collaboration with the Belgian Federal Science Policy Office. Part of this work is financially supported by the EC FP7 Grant Agreement 263466. We thank Bruce Bills for his review. N.R. thanks Philippe Robutel on the discussion to determine the initial conditions of Phobos and Michele Chapront-Touzé, who kindly provided her analytical tables.
References
- Andert, T. P., Rosenblatt, P., Pätzold, M., et al. 2010, Geophys. Res. Lett., 37, 9202 [Google Scholar]
- Andreev, O. N., Antonenko, S. A., Gotlib, V. M., et al. 2010, Sol. Sys. Res., 44, 438 [NASA ADS] [CrossRef] [Google Scholar]
- Asphaug, E., & Melosh, H. J. 1993, Icarus 101, 144 [Google Scholar]
- Asphaug, E., Ryan, E. V., & Zuber, M. T. 2002, in Asteroids III, eds. B. Bottke, A. Cellino, P. Paolocchi, & R. Binzel (Tucson: The University of Arizona Press), 463 [Google Scholar]
- Bois, E., Wytrzyszczak, I., & Journet, A. 1992, Cel. Mech. Dyn. Astron., 53, 185 [Google Scholar]
- Bois, E., Boudin, F., & Journet, A. 1996, A&A, 314, 989 [NASA ADS] [Google Scholar]
- Borderies, N., & Yoder, C. F. 1990, A&A, 233, 235 [NASA ADS] [Google Scholar]
- Bouquillon, S., Kinoshita, H., & Souchay, J. 2003, Cel. Mech. Dyn. Astron., 86, 29 [Google Scholar]
- Cassini, G. D. 1693, Traité de l’Origine et de Progres de l’Astronomie, Paris [Google Scholar]
- Castillo-Rogez, J., Rambaux, N., Rosenblatt, P., & Le Maistre, S. 2011, EPSC-DPS Joint Meeting 2011, 1673 [Google Scholar]
- Chapront-Touze, M. 1988, A&A, 200, 255 [NASA ADS] [Google Scholar]
- Chapront-Touze, M. 1990, A&A, 235, 447 [NASA ADS] [Google Scholar]
- Colombo, G. 1966, AJ, 71, 891 [NASA ADS] [CrossRef] [Google Scholar]
- Duxbury, T. C. 1989, Icarus, 78, 169 [NASA ADS] [CrossRef] [Google Scholar]
- Duxbury, T. C., & Callahan, J. D. 1981, AJ, 86, 1722 [NASA ADS] [CrossRef] [Google Scholar]
- Eckhardt, D. H. 1981, Moon and Planets, 25, 3 [Google Scholar]
- Gastineau, M., & Laskar, J. 2008, TRIP 0.99, Manuel de référence TRIP, Paris Observatory, http://www.imcce.fr/Equipes/ASD/trip/trip.html [Google Scholar]
- Jacobson, R. A. 2010, AJ, 139, 668 [Google Scholar]
- Konopliv, A. S., Yoder, C. F., Standish, E. M., Yuan, D.-N., & Sjogren, W. L. 2006, Icarus, 182, 23 [NASA ADS] [CrossRef] [Google Scholar]
- Lainey, V., Dehant, V., & Patzold, M. 2007, A&A, 465, 1075 [NASA ADS] [CrossRef] [EDP Sciences] [Google Scholar]
- Laskar, J. 1988, A&A, 198, 341 [NASA ADS] [Google Scholar]
- Laskar, J. 2005, in Hamiltonian Systems and Fourier Analysis, eds. D. Benest, C. Froeschler, & E. Lega (Cambridge: Cambridge Scientific Publishers) [Google Scholar]
- Le Maistre, S., Rosenblatt, P., Rambaux, N., Dehant, V., & Marty, J. C. 2012, Planet. Space Sci., submitted [Google Scholar]
- Noyelles, B., Delsate, N., & Carletti, T. 2011, Physica D, submitted [arXiv:1101.2138] [Google Scholar]
- Margot, J. L., Peale, S. J., Jurgens, R. F., Slade, M. A., & Holin, I. V. 2007, Science, 316, 710 [NASA ADS] [CrossRef] [PubMed] [Google Scholar]
- Mathews, P. M., Herring, T. A., & Buffett, B. A. 2002, J. Geophys. Res., 107, 2068 [NASA ADS] [CrossRef] [Google Scholar]
- Michel, P., O’Brien, D. P., Abe, S., & Hirata, N. 2009, Icarus, 200, 503 [NASA ADS] [CrossRef] [Google Scholar]
- Michel, P., Agnolon, D., Brucato, J., et al. 2011, MMSR – a study for a Martian Moon Sample Return mission, ESPC-DPS meeting, abstract#849, Nantes, France, 2nd–7th October [Google Scholar]
- Oberst, J., Lainey, V., & Le Poncin-Lafitte, C. 2011, EPSC-DPS Joint Meeting 2011, held 2–7 October, Nantes, France, 1790 [Google Scholar]
- Peale, S. J. 1969, AJ, 74, 483 [NASA ADS] [CrossRef] [Google Scholar]
- Pesek, I. 1991, Bull. Astron. Inst. Czechosl., 42, 271 [Google Scholar]
- Rambaux, N., & Williams, J. G. 2011, Cel. Mech. Dyn. Astron., 80 [Google Scholar]
- Rambaux, N., Van Hoolst, T., Dehant, V., & Bois, E. 2007, A&A, 468, 711 [NASA ADS] [CrossRef] [EDP Sciences] [Google Scholar]
- Rambaux, N., Castillo-Rogez, J. C., Williams, J. G., & Karatekin, Ö. 2010, Geophys. Res. Lett., 37, 4202 [NASA ADS] [CrossRef] [Google Scholar]
- Rambaux, N., Van Hoolst, T., & Karatekin, Ö. 2011, A&A, 527, A118 [NASA ADS] [CrossRef] [EDP Sciences] [Google Scholar]
- Rivoldini, A., Rosenblatt, P., Rambaux, N., & Dehant, V. 2011, Mass distribution inside Phobos: A key observational constraint for the origin of Phobos, The Second Moscow Solar system Symposium (2M-S3), Moscow, Russia, October 10–14 [Google Scholar]
- Robutel, P., Rambaux, N., & Castillo-Rogez, J. 2011, Icarus, 211, 758 [NASA ADS] [CrossRef] [Google Scholar]
- Rosenblatt, P. 2011, A&ARv, 19, 44 [NASA ADS] [CrossRef] [Google Scholar]
- Rosenblatt, P., Le Maistre, S., Rivoldini, A., et al. 2011, The Second Moscow Solar System Symposium (2M-S3), Moscow, Russia, October 10–14 [Google Scholar]
- Schutz, B. E. 1981, Cel. Mech., 24, 173 [Google Scholar]
- Simon, J. L., Bretagnon, P., Chapront, J., et al. 1994, A&A, 282, 663 [NASA ADS] [Google Scholar]
- Thomas, N., Britt, D. T., Herkenhoff, K. E., et al. 1999. J. Geophys. Res., 105, 15091 [Google Scholar]
- Tisserand, F. 1891, Traitée de Mécanique Céleste, Tome II (Paris: Gauthier-Villars et fils) [Google Scholar]
- Turyshev, S. G., Farr, W., Folkner, W. M., et al. 2010, Exper. Astron., 28, 209 [Google Scholar]
- Williams, J. G., Sinclair, W. S., & Yoder, C. F. 1978, Geophys. Res. Lett., 5, 943 [NASA ADS] [CrossRef] [Google Scholar]
- Williams, J. G., Boggs, D. H., Yoder, C. F., Ratcliff, T., & Dickey, J. O. 2001, J. Geophys. Res., 106, 27,933 [Google Scholar]
- Willner, K., Oberst, J., Hussmann, H., et al. 2010, Earth Planet. Sci. Lett., 294, 541 [NASA ADS] [CrossRef] [Google Scholar]
- Yoder, C. F. 1995, in Global Earth Physics, A Handbook of Physical Constants, AGU Reference Shelf 1 [Google Scholar]
Appendix A: Spherical harmonics of degree 3
Phobos has an irregular shape, and we include in our study the spherical harmonics representation of the shape developed to degree and order 3. The numerical values of the higher degree are obtained form the relationship (Yoder 1995) 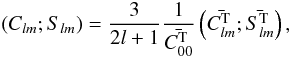 (A.1)where Clm;Slm are the gravity coefficients of the spherical harmonics of degree l and order m and the
  are the corresponding coefficients for the topography. In this case, we obtain the gravity coefficients listed in Table A.1. They differ significantly from the degree and order 3 obtained by Borderies & Yoder (1995), which were based on the topographic model of Duxbury (1989). Higher-degree harmonics are of lesser impact, therefore we limit the development to degree three (see Sect. 4.5).
Third-degree spherical harmonics of Phobos’ gravity field used in this study (derived from the topography of Willner et al. 2010), assuming a homogeneous composition.
All Tables
Main frequencies and periods that describe the orbit of Phobos used in the analysis.
Fourier series of the oscillations in the τ angle of Phobos with respect to the ESAPHO reference frame.
Third-degree spherical harmonics of Phobos’ gravity field used in this study (derived from the topography of Willner et al. 2010), assuming a homogeneous composition.
All Figures
|
Fig. 1 Absolute value of the ratio of the magnitude of the perturbed torques, due to degree 3 (red curve) and due to the Martian oblateness (green curve), over the main torque due to the degree 2 versus the distance of Phobos to Mars. The vertical line marks the actual present distance of Phobos to Mars. |
| In the text | |
|
Fig. 2 Temporal evolution of the physical libration in longitude τ of Phobos over 40 years a) and 18 h b). The thickness of the line in panel a) is due to rapid oscillations with an amplitude of ± 1 degree at the orbital period of Phobos as shown in panel b). The trend in panel a) is quadratic and corresponds to the tidal evolution of the orbit (semi-major axis decay). |
| In the text | |
|
Fig. 3 Projection of the polar motion p1,p2 on the sky of Phobos. The angles are multiplied by the mean radius of Phobos, 11.3 km, to display the results in meters. The motion is represented over 2.7 days. |
| In the text | |
|
Fig. 4 a) Projections of the spin pole (red curve) and orbital pole (green curve) of Phobos during one precession period of 2.32 years. The blue cross and black point indicate the initial conditions for the spin and orbital poles. The difference between the two curves corresponds to the instantaneous obliquity oscillations that oscillates with larger amplitudes than the value of the mean obliquity (see text for details). |
| In the text | |
|
Fig. 5 Interior structure model of Phobos. In this model, the impact that formed the Stickney crater has led to macroporosity (Asphaug & Melosh 1993), representing the main source of lateral heterogeneity. The gray part sketches the geometry that we used to compute the lateral heterogeneity, see text for details. Radial heterogeneity comes from a thick outer regolith layer and a high (macro)porosity layer created as a consequence of impacting of the material, but assumed to be laterally homogeneous, except in the region of Stickney. |
| In the text | |
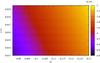 |
Fig. 6 Mean value of the obliquity of Phobos η as a function of the gravity coefficients J2, C22, and for a value of the polar moment of inertia C/MR2 equal to 0.524 (Willner et al. 2010). |
| In the text | |
Current usage metrics show cumulative count of Article Views (full-text article views including HTML views, PDF and ePub downloads, according to the available data) and Abstracts Views on Vision4Press platform.
Data correspond to usage on the plateform after 2015. The current usage metrics is available 48-96 hours after online publication and is updated daily on week days.
Initial download of the metrics may take a while.