Fig. 4
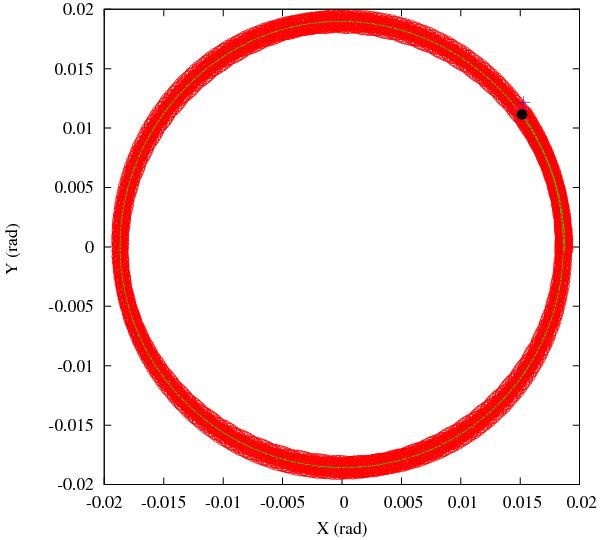
a) Projections of the spin pole (red curve) and orbital pole (green curve) of Phobos during one precession period of 2.32 years. The blue cross and black point indicate the initial conditions for the spin and orbital poles. The difference between the two curves corresponds to the instantaneous obliquity oscillations that oscillates with larger amplitudes than the value of the mean obliquity (see text for details).
Current usage metrics show cumulative count of Article Views (full-text article views including HTML views, PDF and ePub downloads, according to the available data) and Abstracts Views on Vision4Press platform.
Data correspond to usage on the plateform after 2015. The current usage metrics is available 48-96 hours after online publication and is updated daily on week days.
Initial download of the metrics may take a while.