Fig. 5
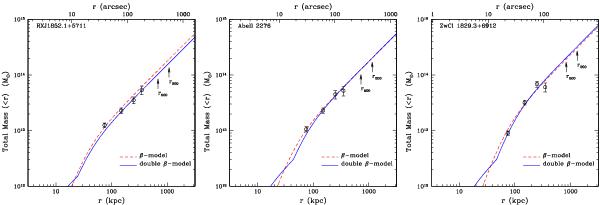
Total mass profiles for the isothermal β-model and double β-model shown as dashed and continuous lines, respectively. The dots represent the total mass profile derived from the measured deprojected temperature profile by fixing the density profile to the best fit of the double β-model. The arrows indicate the radii at overdensities of 500 and 200 times the critical density.
Current usage metrics show cumulative count of Article Views (full-text article views including HTML views, PDF and ePub downloads, according to the available data) and Abstracts Views on Vision4Press platform.
Data correspond to usage on the plateform after 2015. The current usage metrics is available 48-96 hours after online publication and is updated daily on week days.
Initial download of the metrics may take a while.