Fig. 4
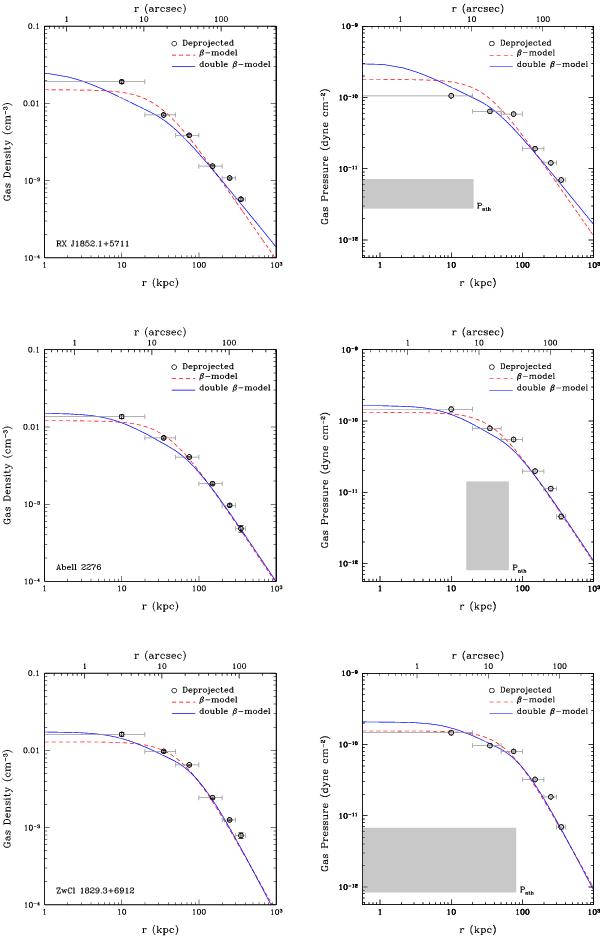
Radial profiles of gas density (left-column panels) and pressure (right-column panels). The open dots represent the result of the deprojected spectral analysis while the dashed and continuous line represent the trend of the isothermal β-model and double β-model, respectively. The shaded areas represent the range of non-thermal pressure of the radio lobes under the minimum energy assumption, see Sect. 4.2.
Current usage metrics show cumulative count of Article Views (full-text article views including HTML views, PDF and ePub downloads, according to the available data) and Abstracts Views on Vision4Press platform.
Data correspond to usage on the plateform after 2015. The current usage metrics is available 48-96 hours after online publication and is updated daily on week days.
Initial download of the metrics may take a while.