Fig. 1
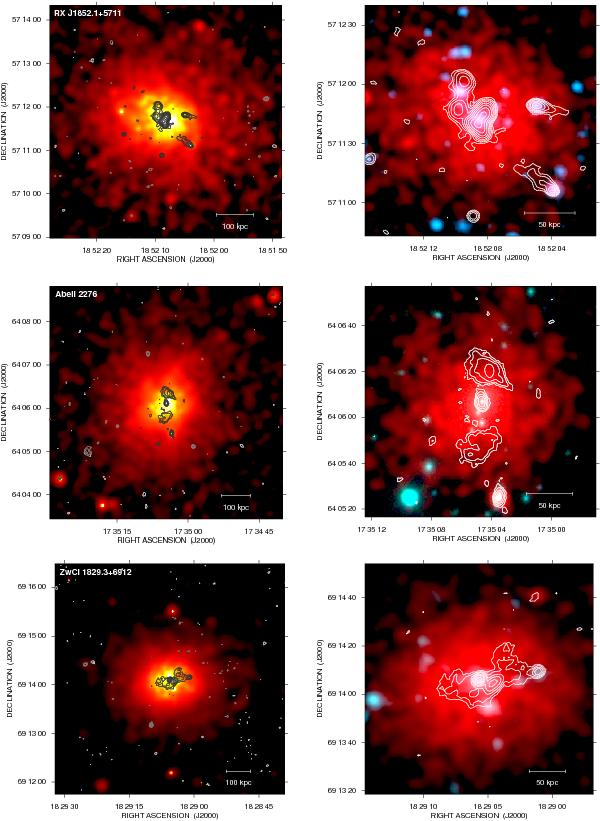
Background-subtracted and exposure-corrected Chandra ACIS-I image in the 0.5−7 keV band of RX J1852.1+5711, Abell 2276, and ZwCl 1829.3+6912. In the left-column panels the adaptively smoothed Chandra images are shown with the VLA radio contours at 1.4 GHz overlaid. A zoom of the central regions of the galaxy clusters are shown in the right-column panels. Red tones represent the Chandra image smoothed with a Gaussian kernel with σ = 2″ while the blue tones represent the optical images from the DSS (RX J1852.1+5711 and ZwCl 1829.3+6912) and SDSS (A2276).
Current usage metrics show cumulative count of Article Views (full-text article views including HTML views, PDF and ePub downloads, according to the available data) and Abstracts Views on Vision4Press platform.
Data correspond to usage on the plateform after 2015. The current usage metrics is available 48-96 hours after online publication and is updated daily on week days.
Initial download of the metrics may take a while.