Fig. 8
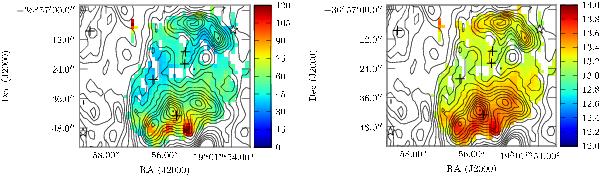
Left: H2CO rotational temperature map of the IRS7 region from SMA/APEX data. Temperatures are in K. Right: p-H2CO LTE column density map of the IRS7 region. The colour scale bar shows values in log 10N, where N is given in cm-2. Both maps use the integrated intensities of three para-H2CO lines around 218 GHz, and only data points that are inside the SMA primary beams and where all three lines have 5σ detections or stronger are considered. All other points are represented by white pixels. The temperatures and column densities are calculated with rotational diagrams for line intensities integrated between 0 and 9 km s-1. The contours show the integrated intensity of the H2CO 303–202 line in the same velocity interval, with contours every 2 K km s-1 (~3σ at the edge of the primary beam). Refer to Fig. 1 for a guide to the symbols used for the compact objects.
Current usage metrics show cumulative count of Article Views (full-text article views including HTML views, PDF and ePub downloads, according to the available data) and Abstracts Views on Vision4Press platform.
Data correspond to usage on the plateform after 2015. The current usage metrics is available 48-96 hours after online publication and is updated daily on week days.
Initial download of the metrics may take a while.