Free Access
Fig. 6
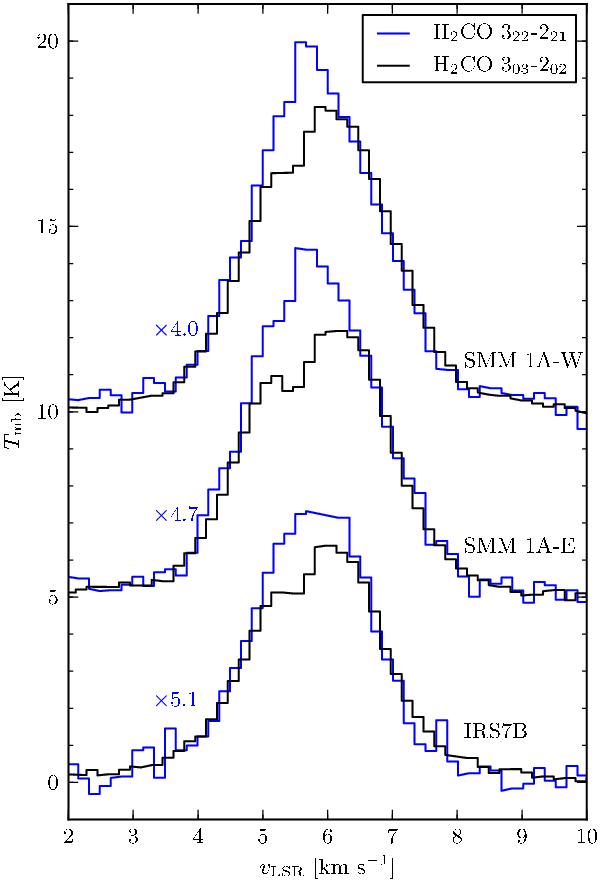
APEX spectra for H2CO 303–202 (black) and H2CO 322–221 (blue), the latter line is scaled with different factors (4.0, 4.7, and 5.1 from top to bottom) to make the Gaussian tails fit. The vertical shifts between the spectra are 5 K. The H2CO 321–220 (not displayed) has a shape similar to the H2CO 322–221 line.
Current usage metrics show cumulative count of Article Views (full-text article views including HTML views, PDF and ePub downloads, according to the available data) and Abstracts Views on Vision4Press platform.
Data correspond to usage on the plateform after 2015. The current usage metrics is available 48-96 hours after online publication and is updated daily on week days.
Initial download of the metrics may take a while.