Fig. 3
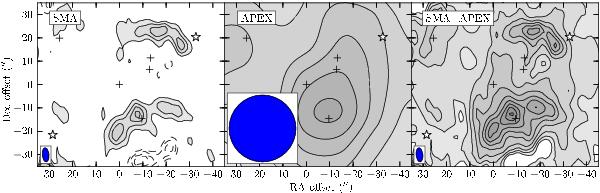
Left: H2CO 303–202 line emission detected by the SMA integrated between 0 and +9 km s-1. Middle: H2CO 303–202 line emission observed by the APEX telescope in a 7 × 7 grid integrated between 0 and +9 km s-1. Right: H2CO 303–202 line emission in the combined SMA interferometry and APEX short-spacing data integrated between 0 and +9 km s-1. Contours are at 2.5 Jy beam-1 km s-1 levels (converted to SMA beams, ~5σ at the edge of the SMA primary beam) in all three maps. Negative intensities are represented by dashed contours. Coordinates are offsets from the central position of IRS7B. Refer to Fig. 1 for a guide to the symbols used for the compact objects.
Current usage metrics show cumulative count of Article Views (full-text article views including HTML views, PDF and ePub downloads, according to the available data) and Abstracts Views on Vision4Press platform.
Data correspond to usage on the plateform after 2015. The current usage metrics is available 48-96 hours after online publication and is updated daily on week days.
Initial download of the metrics may take a while.