Free Access
Fig. A.3
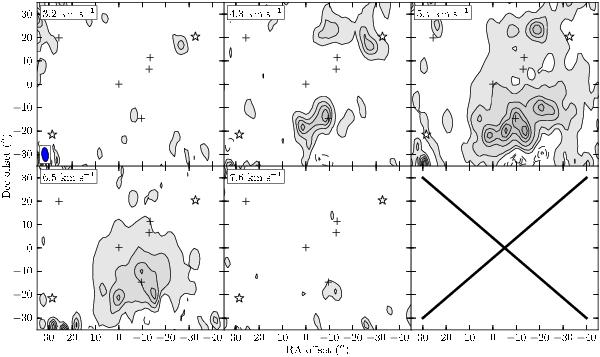
SMA/APEX channel maps of the H2CO 322–221 line. Contours every 0.5 Jy beam-1 km s-1 (~3σ at edge of primary beam). Refer to Fig. 1 for a guide to the symbols used for the compact objects.
Current usage metrics show cumulative count of Article Views (full-text article views including HTML views, PDF and ePub downloads, according to the available data) and Abstracts Views on Vision4Press platform.
Data correspond to usage on the plateform after 2015. The current usage metrics is available 48-96 hours after online publication and is updated daily on week days.
Initial download of the metrics may take a while.