Fig. 13
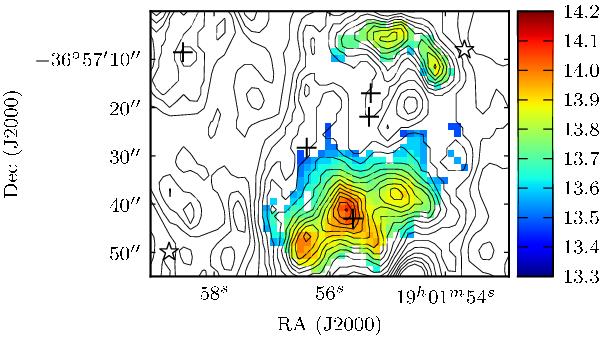
p-H2CO column densities for the least-χ2 fits to RADEX data and the observed H2CO lines to a constant temperature in each ridge (60 K in northern ridge and 76 K in southern ridge) and an H2 density of 106 cm-3. The colour bar shows values in log 10N, where N is given in cm-2. Refer to Fig. 1 for a guide to the symbols used for the compact objects.
Current usage metrics show cumulative count of Article Views (full-text article views including HTML views, PDF and ePub downloads, according to the available data) and Abstracts Views on Vision4Press platform.
Data correspond to usage on the plateform after 2015. The current usage metrics is available 48-96 hours after online publication and is updated daily on week days.
Initial download of the metrics may take a while.