Fig. 12
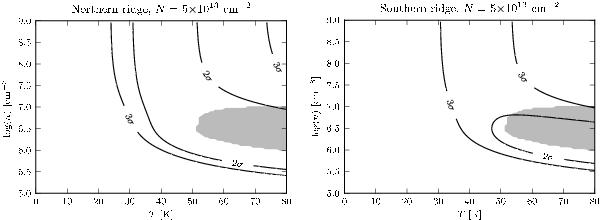
χ2-confidence contour plots for temperature and number density determined from the observed H2CO lines and RADEX models. Left: fit to the average intensity in the northern ridge, N = 5 × 1013 cm-2. Right: fit to the average intensity in the southern ridge, N = 5 × 1013 cm-2. The greyed areas represent solutions with masing H2CO emission.
Current usage metrics show cumulative count of Article Views (full-text article views including HTML views, PDF and ePub downloads, according to the available data) and Abstracts Views on Vision4Press platform.
Data correspond to usage on the plateform after 2015. The current usage metrics is available 48-96 hours after online publication and is updated daily on week days.
Initial download of the metrics may take a while.