Free Access
Fig. 11
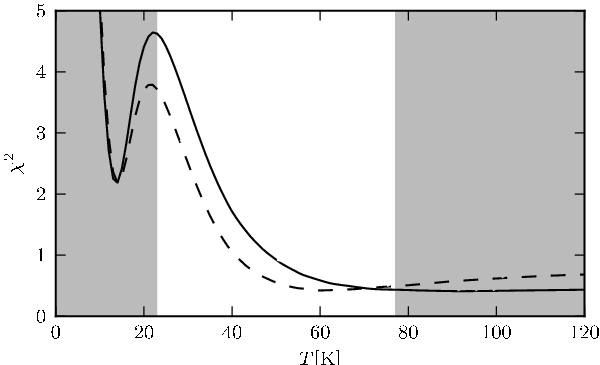
χ2 fits to RADEX data and the observed H2CO lines to a constant temperature with variable column density (see Fig. 13) and an H2 density of 106 cm-3 for the northern ridge (dashed) and the southern ridge (solid). The greyed areas in the plot correspond to solutions with τ > 10 (left) and τ < 0 (right).
Current usage metrics show cumulative count of Article Views (full-text article views including HTML views, PDF and ePub downloads, according to the available data) and Abstracts Views on Vision4Press platform.
Data correspond to usage on the plateform after 2015. The current usage metrics is available 48-96 hours after online publication and is updated daily on week days.
Initial download of the metrics may take a while.