Fig. 1
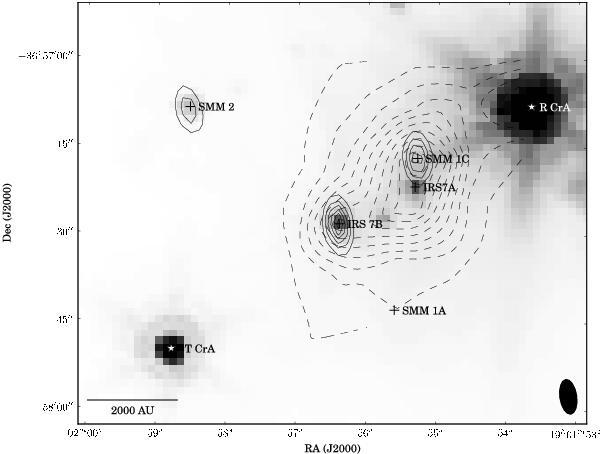
SMA 1.3 mm continuum (10σ solid contours, σ = 4.7 mJy beam-1), Herschel PACS 70 μm continuum (10 Jy dashed contours; see also Lindberg et al., in prep.), and Spitzer 4.5 μm image (greyscale; see also Peterson et al. 2011). The Herschel PACS beam size is 9′′, and the data consist of two overlapping 5 × 5 spaxel arrays, with a 9.4″ × 9.4′′ spaxel size. The SMA beam size (6.0″ × 2.9′′) is shown in the bottom right corner. The plus signs indicate the positions of the YSOs (Peterson et al. 2011) and SMM 1A (Nutter et al. 2005), and the star symbols indicate the positions of R CrA and T CrA (Peterson et al. 2011). These symbols will be used throughout the paper.
Current usage metrics show cumulative count of Article Views (full-text article views including HTML views, PDF and ePub downloads, according to the available data) and Abstracts Views on Vision4Press platform.
Data correspond to usage on the plateform after 2015. The current usage metrics is available 48-96 hours after online publication and is updated daily on week days.
Initial download of the metrics may take a while.