Fig. 11
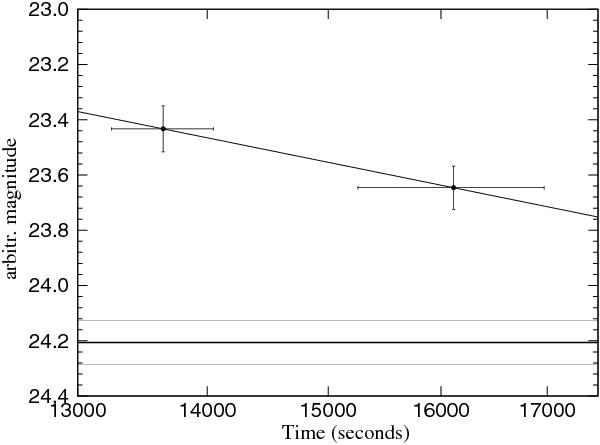
Combined GROND g′r′i′ white-band light curve of the decaying afterglow of GRB 100117A, centered on galaxy (Fig. 10). The host galaxy magnitude is shown as a straight line, including the 1σ error (measured by GROND eight months after the burst). Note that the y-axis shows arbitrarily magnitudes.
Current usage metrics show cumulative count of Article Views (full-text article views including HTML views, PDF and ePub downloads, according to the available data) and Abstracts Views on Vision4Press platform.
Data correspond to usage on the plateform after 2015. The current usage metrics is available 48-96 hours after online publication and is updated daily on week days.
Initial download of the metrics may take a while.