Free Access
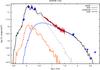
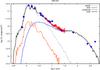
Fig. 4
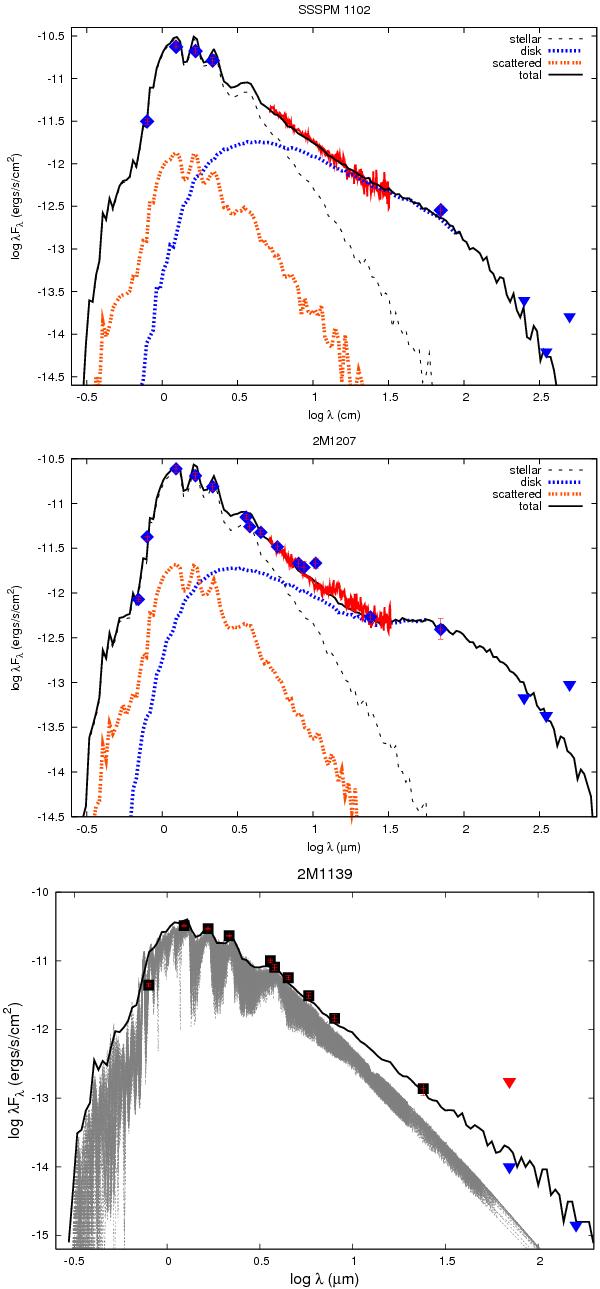
The best-fit models for SS1102, 2M1207, and 2M1139 (bottom). Also shown is the contribution from the disk (blue) and the stellar photosphere (grey). The Spitzer/IRS spectrum is shown in red. Blue points are the Herschel upper limits. For 2M1139, the red point marks the Spitzer 70 μm upper limit.
This figure is made of several images, please see below:
Current usage metrics show cumulative count of Article Views (full-text article views including HTML views, PDF and ePub downloads, according to the available data) and Abstracts Views on Vision4Press platform.
Data correspond to usage on the plateform after 2015. The current usage metrics is available 48-96 hours after online publication and is updated daily on week days.
Initial download of the metrics may take a while.